Reports
Articles in this Topic
Related Articles
The Reporting feature within ModalConnect provides a core list of pre-defined queries - (Stored Procedures) which can be used to create Reports sourcing the data in ModalConnect.
The ModalConnect Reporting module integrates DevExpress Report designer.
Master template reports can be created for frequently required reports or create customised one-off reports. Reports can be made available to specified Users. User permissions ensure Reports only return data that the logged in user running the Report has permissions to access.
View Reports
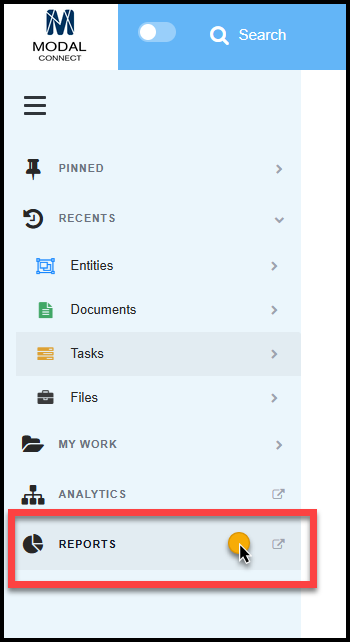
To access Reports module select Reports from the Workspace left menu (permissions apply).
This opens the Reports page with a list of any existing Reports available to the user and is also where new Reports can be created.
On the Reports page click the 'Add New Report' button which opens the Add Report panel. Give the report a Title which must be unique and not in use (this can include Report Titles that are not visible to the logged in user), and a description. When completed click Save.

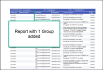
The new Report is added to the list. The next step is to design the Report content and specify the data required.
To do this, open the Report by clicking on the Report Title.
Note; Do not edit the Report Title once saved. The Description can be edited. The Report name added in the Designer can be edited as this is separate to the Title.
The Report menu includes the following pages;
- Details - the Report info includes the Title and description, the user and date of when created and last modified (details).
- Report Designer - the Report design and content interface.
- Report Viewer - where the Report output can be viewed.
- Report Users - this is where other Users can be assigned to the Report.

Report Details
The Report details are those recorded when the Report was added. These can be edited (Title and Description only) by clicking on the Edit button which opens the Edit Report panel - click Save to save changes. The ModifiedBy and Modified-Date are updated automatically on the latest changes to these Details.
The Report Designer is where the 'building' of the Report takes place. The layout, design and selection of the data content. Note - this page may take a few seconds to load with all the available content - particularly on the first view.
The main steps in designing a Report are to
- Build the Report starting from the Report Wizard
- Select Stored Procedure/s
- Select data Fields
- Add other Parameters if required for Filters
- Use the Toolbox and Formatting tools for the final design

-
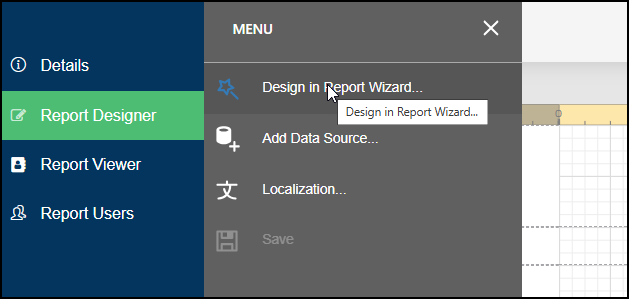
Open Report Wizard
Open the designer menu at the top left of the Designer and select - Design in Report Wizard
-
Select the Report Type
The Report Type is preset to ' Table Report' so just click Next (bottom right of screen).
-
Select Data Source
The data Source is preset to 'Database' so just click Next.
-
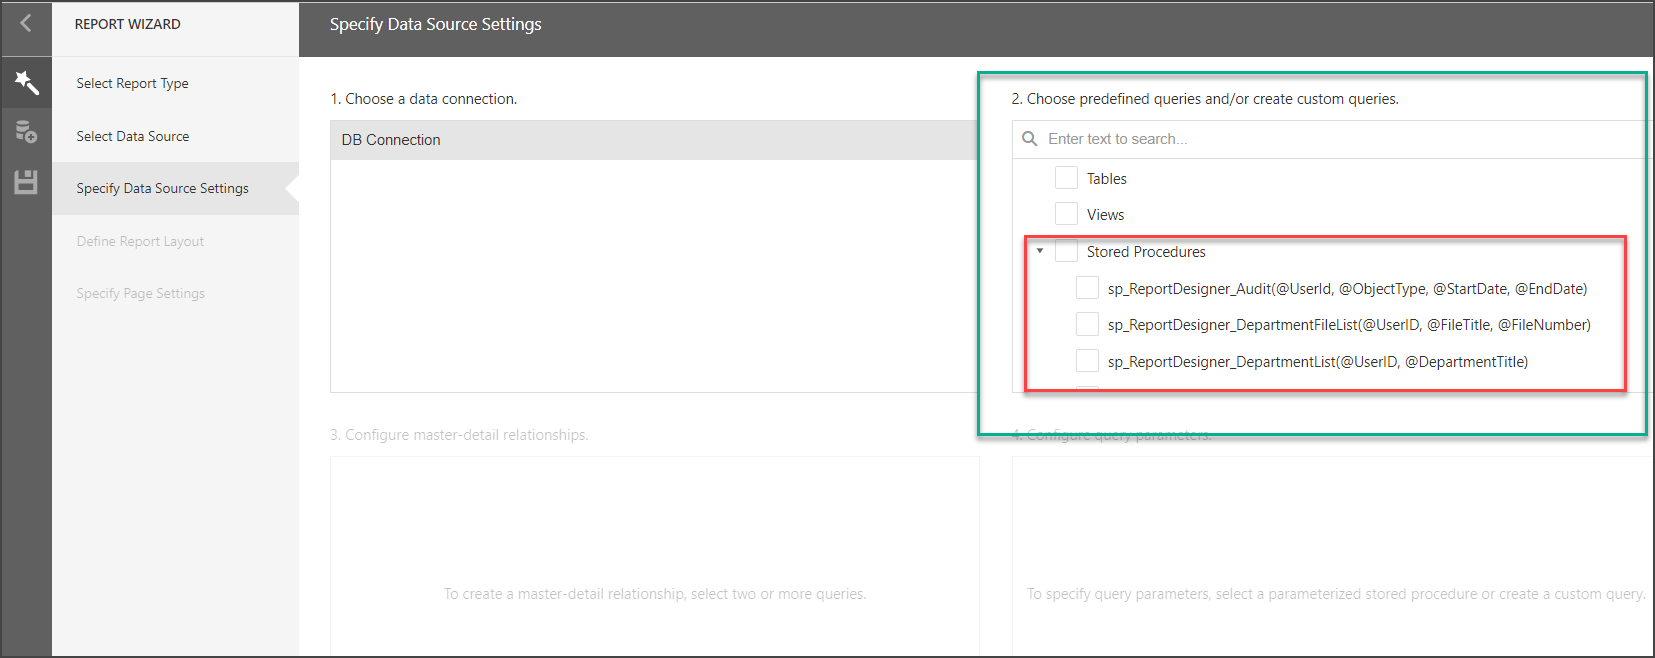
Specify Data Source Settings
This is where you can choose from a list of predefined queries under Stored Procedures.
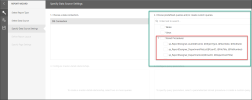
Stored Procedures
Stored procedures are queries that have been predefined. A list of the Stored Procedures available showing the Stored procedure Title, Parameters and the Data Fields available can be viewed here in the Stored Procedures List
Reports can be created using a single query or by joining queries (where they share at least 1 data field).
Expand the Stored Procedures to view the list available - scroll down to view all. To select the required query, click the checkbox to the left of it.
Single Stored Procedure
- Once a single query has been selected, click Next to continue
-
Define Report Layout
This is where the data fields to include in the Report are selected. To include a count e.g to count the number Documents or Entities then include the DocumentId or DocID for Documents or EntityID for Entities.
Single Query
On this page in pane 1 select the query (1), then in pane 2 , for a single Stored procedure expand the query to view and select the data fields required (3). Example - File Name, Document Title, Document Creation Date etc

If any of the data fields are required as Parameters to filter the Report by, then these must also be selected. View the Parameters in the Stored Procedures List
Add Group
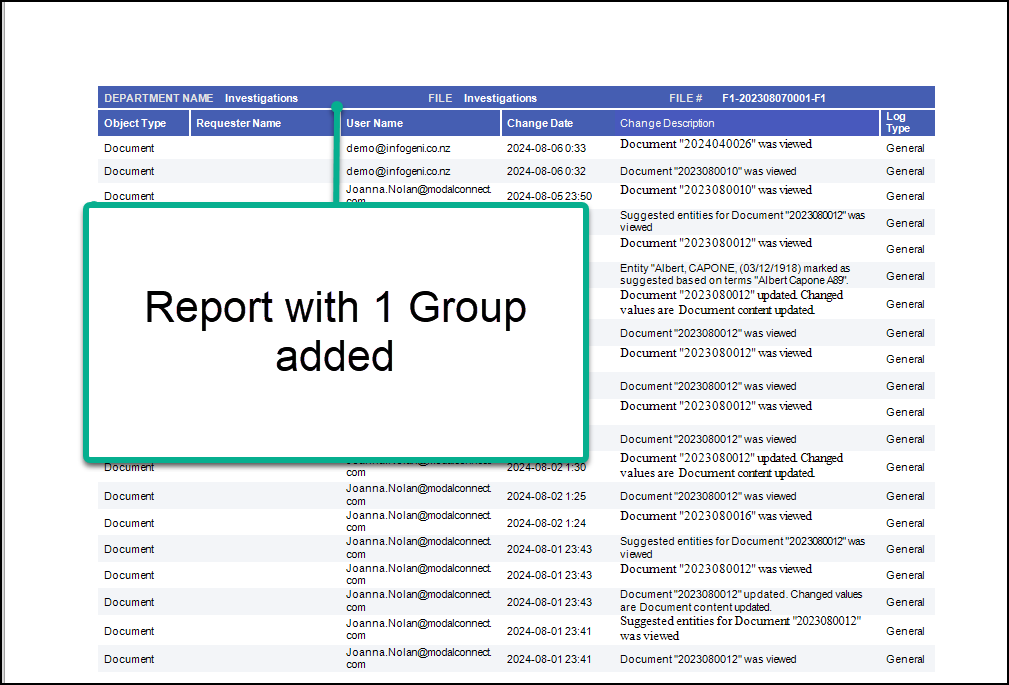
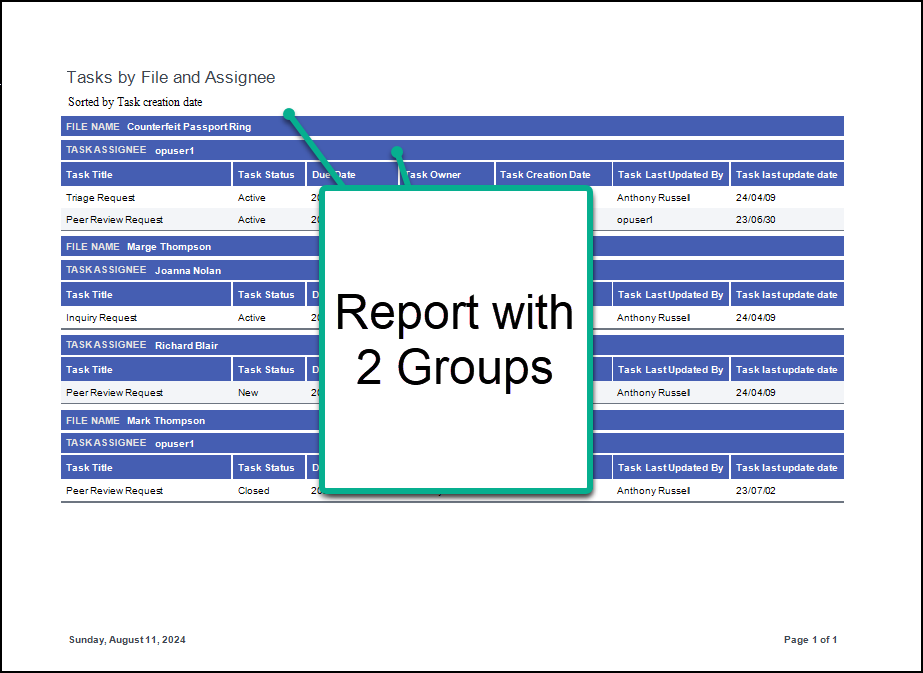
Optional - Grouping data enables data to be grouped e.g by specific fields - e.g per Department and\or File etc. Each Group then displays as a separate row and in the order added. See the examples below. It is not necessary to Group all data fields e.g- the layout could include 1 or 2 Groups and the detail data under that. The limit is 5 groups per query (Typically 1 or 2 Groups works well).
Click Add Group to select the data fields for each row.
Group Layout examples


Add Summary Functions
Optional - In pane 4 - For some data types (field types ending with ID) a summary field can be used to apply a Function to - e.g Count. (ensure that the summary field selected has not been used in groups but has been selected as a data field).
To add a Function - expand the Report query name under Field (only shows where a field ending in ID has been selected). Select the required ID field that the function will be applied to. In the Summary Functions area select the Function type to apply.

Click Next to proceed to Specify Page Settings
Joining Queries
To join queries, in pane 1 select the joined query at both level 1 and 2 - e.g you only select those queries that can be expanded to more than 1 level.
Next in pane 2, to select the data fields - from the joined query (2nd in the list), from the un-expanded detail select the fields that will sit at the top of the report.
Then expand the query (as per the example below) to select the fields that will go under those selected above. Note - the level 2 list runs slightly to the right and scrolling down where it goes into level 1 it runs more on the left and shows the pre-selected level 1 fields.
Add Group for Joined Queries
Grouping data enables data to be grouped e.g by specific fields - e.g per Department and\or File etc. Each Group then displays as a separate row and in the order added. It is not necessary to Group all data fields - e.g the layout could include 1 or 2 Group headers and the rest of the data under that. The limit is 5 groups per query (Typically 1 or 2 Groups works well).
Click Add Group to select the data fields for each row.
Add Summary Function
Optional - In pane 4 - For some data types (field types ending with ID) a summary field can be used to apply a Function to - e.g Count. (ensure that a summary field has not been used in groups but has been selected as a data field). See the example above for a Single query.
Click Next to proceed to the Specify Page Settings page.
-
Specify Page Settings
The page settings and colour scheme can be set and a Title added
- The orientation can be changed from the default Portrait to Landscape.
- The default colour scheme (for the header colour) is grey - to select a different colour click on a colour tile or using the custom tile specify the colour (scroll down the colour tiles to view all colour options).
- In pane 2 a preview of the layout is shown and you can add the Report Title.

Tip: If the layout / data fields need editing, select Previous to go back to the Define Report Layout or back again to select queries and/or to reconfigure a Master Relationship. Where Groups have been used, not all data fields will show on the page settings view but will show once Finished back on the main Report designer view.
Click Finish.
The Report Wizard closes and the Report opens back on the main Report Designer page.Save the Report Design
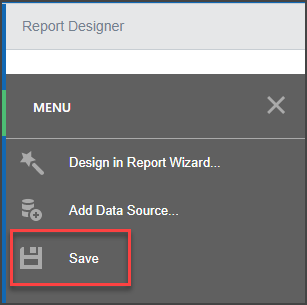
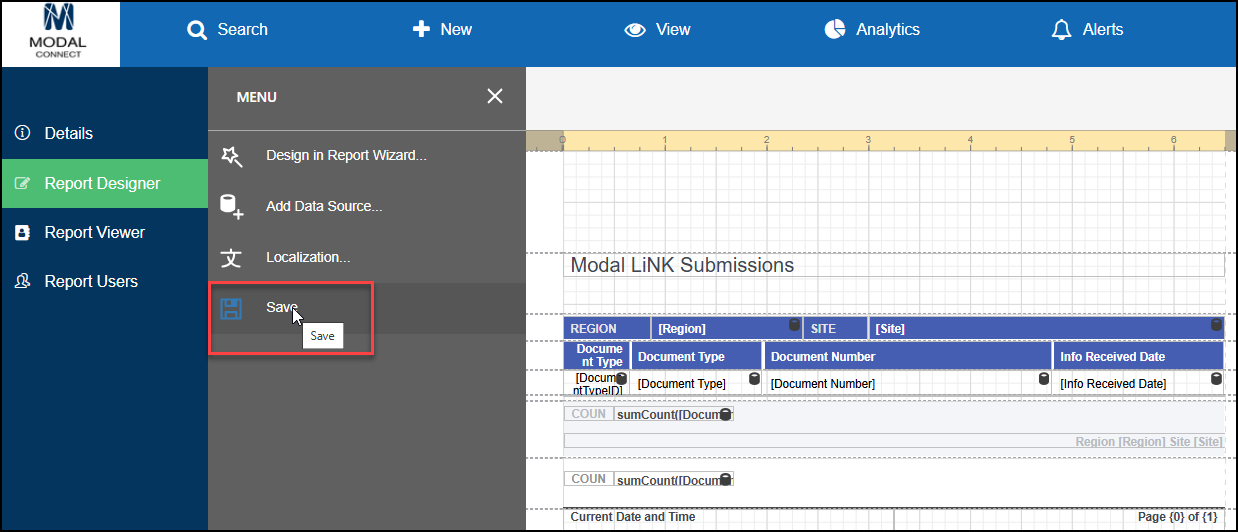
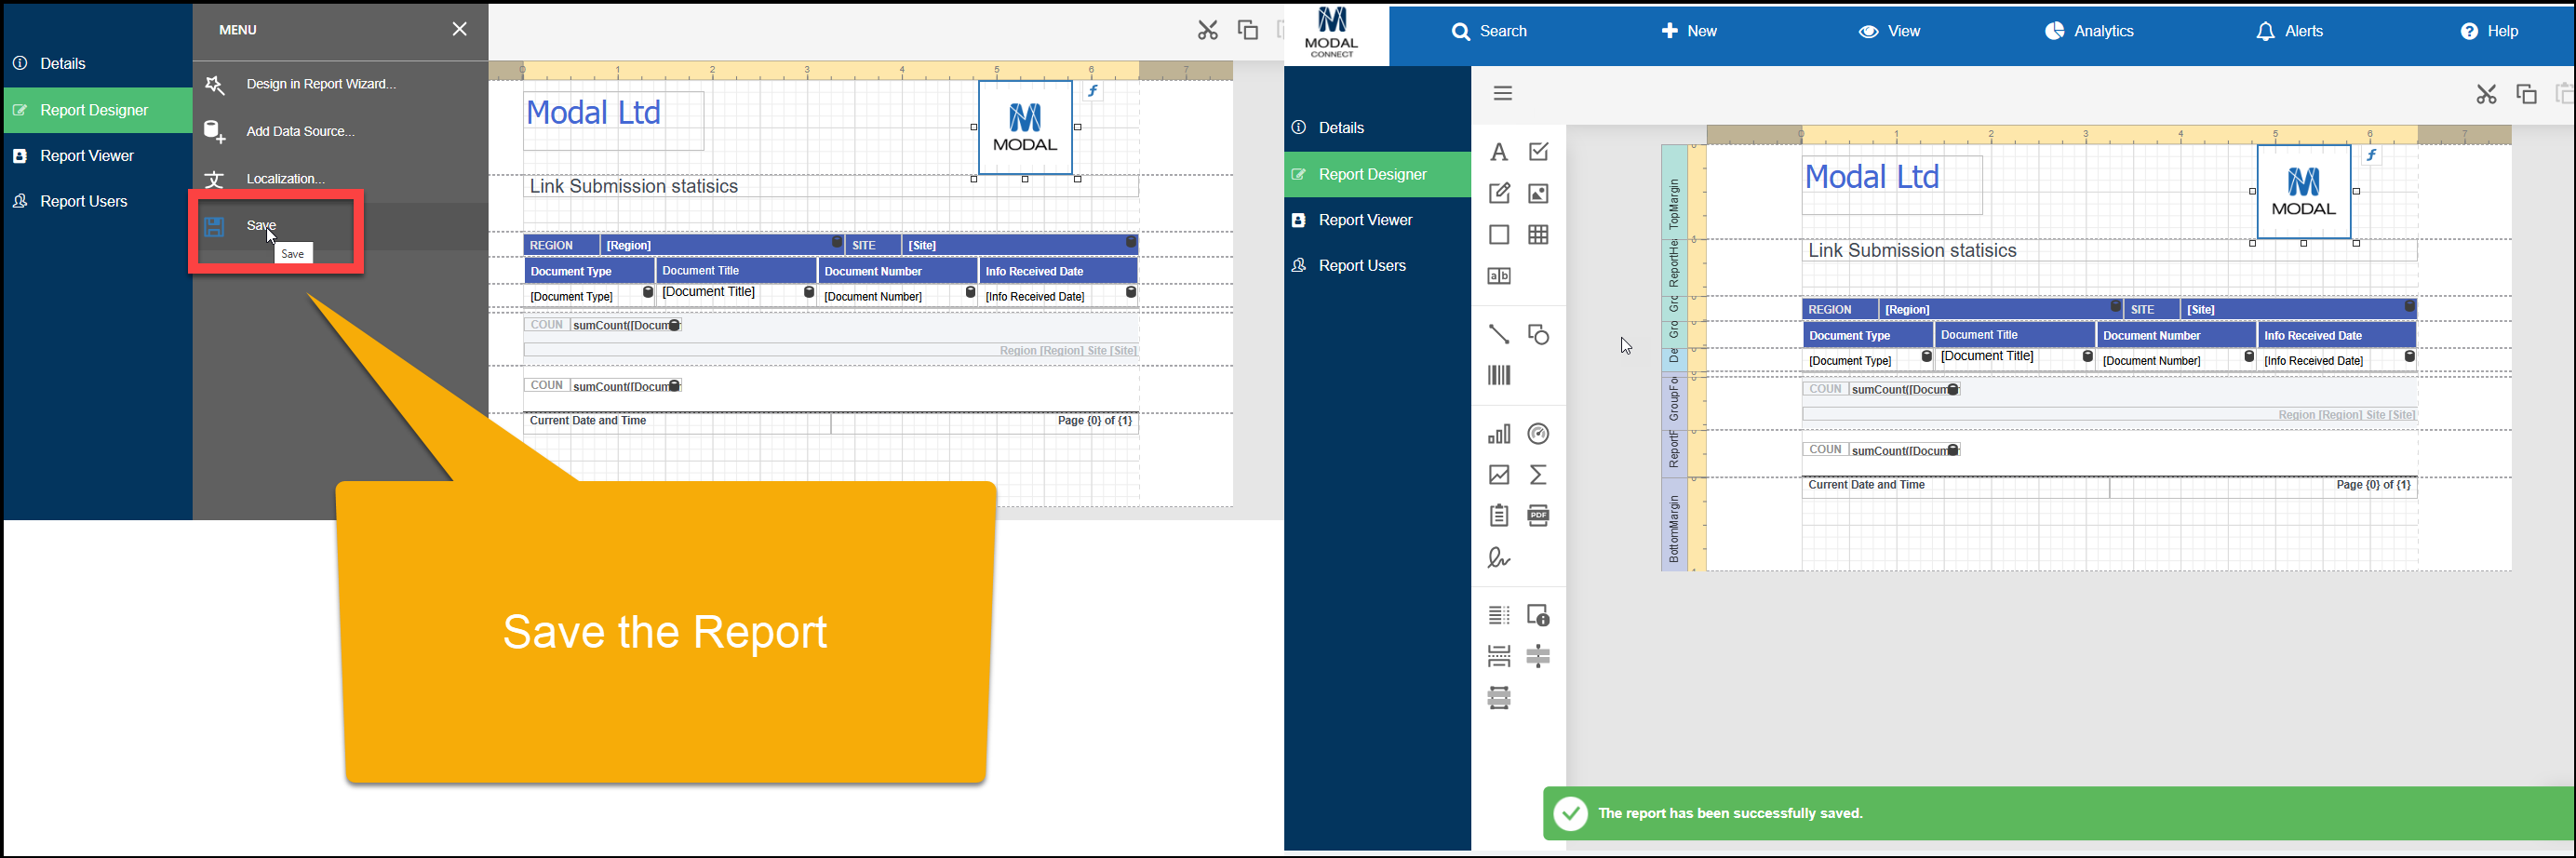
Open the Report Designer menu and click Save.

Tip: Always Save changes before leaving the Report Designer


Parameters are set via a 2 step process both within the Expression Editor via the Query and again via the Parameters used for Filters in the Report viewer.
Parameter Settings Step 1
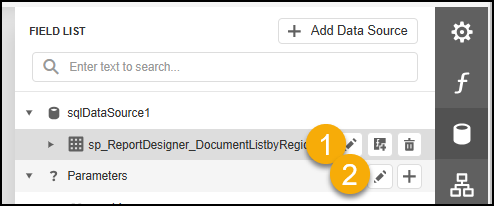
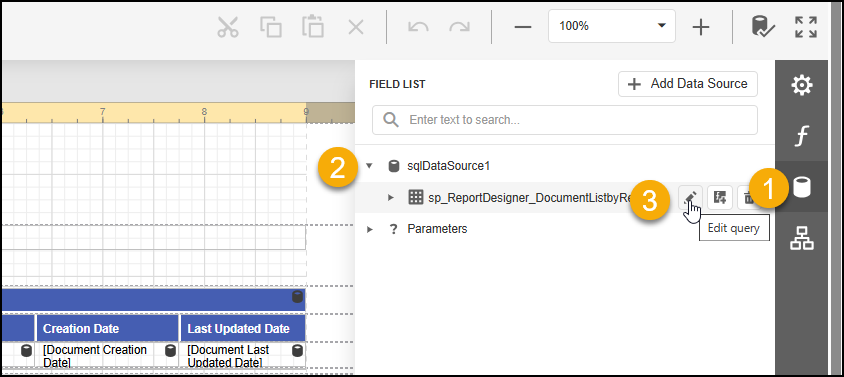
To configure parameters - on the main Report Designer page select the data source Fields icon from the far right menu.
- Click on the data fields icon in the right side menu
- Expand the data source to reveal the stored procedure (query) name
- Click on the stored procedure title to show the editing tools then click the Edit query icon (pen).

The selected query is pre-selected in the 'Data Source Wizard' window so just select Next.
In the next panel of the Data Source Wizard, a list of the available parameters from the query is shown.
Note the userid is automatically set so requires no further configuration.
Note: While this list shows all parameters available, these must have been selected to add when the Designing the Report
- Expand Parameters*
- Double click on userid which passes this into the top of the panel (or you can just type ?Userid in at 3, (ensure to put the ? in front).
- Remove any detail like a 0 including spaces after the Parameter name (backspace to the d).
Click Save then Finish
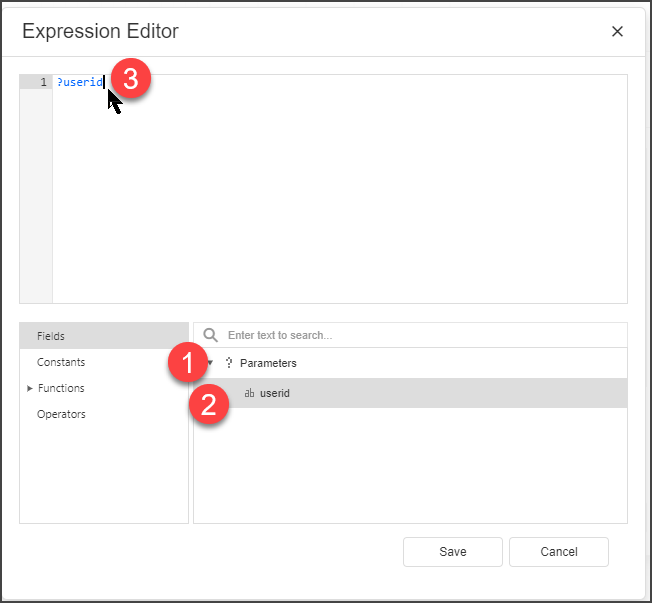
* Tip - Ensure your screen resolution is set to 100% when working with the Expression Editor or you may not be able to see all of the available data and functions.
Step 2 Configure Parameters
Enabling Parameters for filtering a Report is a 2 step process where in Step 1 - the Parameter data field is first passed to the stored procedure in the Expression Editor and then Step 2 - the data field is added to the Report as a Parameter to enable it as a filter.
Date filters should be used where available otherwise all results will be returned.
Adding Parameters for Filters
Parameters are available for all Reports (these vary per Report), you have the option to add these to the query which then enables the Report to be filtered by any of those Parameters. For example if results are to be filtered by Department and\or File or Dates.
Note: The Parameter fields available, are only those shown in the Data Source Wizard for the selected query. To view a list of the Parameters available for any Stored Procedure, in the Help pages see the Parameters column in the Stored Procedures List
Where data volumes returned are likely to be very high, to prevent overloading the system it is recommended to use Date parameters to filter results. E.G Filter the Audit or Document list Report by adding and using the Start (From) Date and End (To) Date.
Step 1: Pass the Parameter to the Report
To pass a Parameter to the Report - on the main Report Designer page select the data source Fields icon from the far right menu.
- Click on the data fields icon in the right side menu
- Expand the data source to reveal the stored procedure name
- Click on the stored procedure to show the editing tools. Click the Edit query icon (pen).
The selected query is preselected in the 'Data Source Wizard' so just select Next.
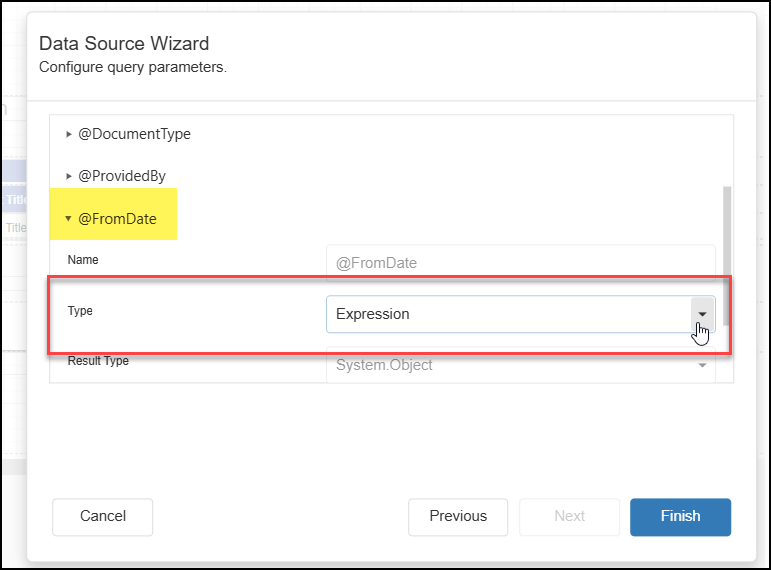
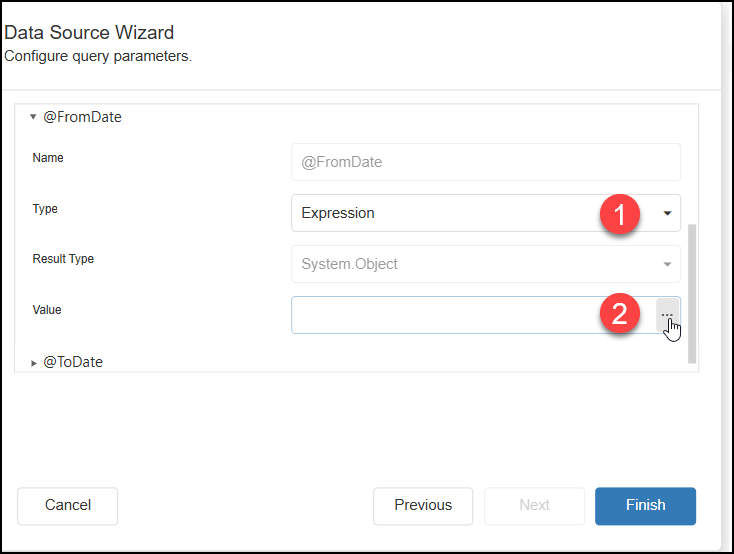
- In the next panel of the Data Source Wizard, expand the required Parameter and change the Type to Expression.

- Next, to set the value - click on the ellipsis in the Value to open the Expression Editor.
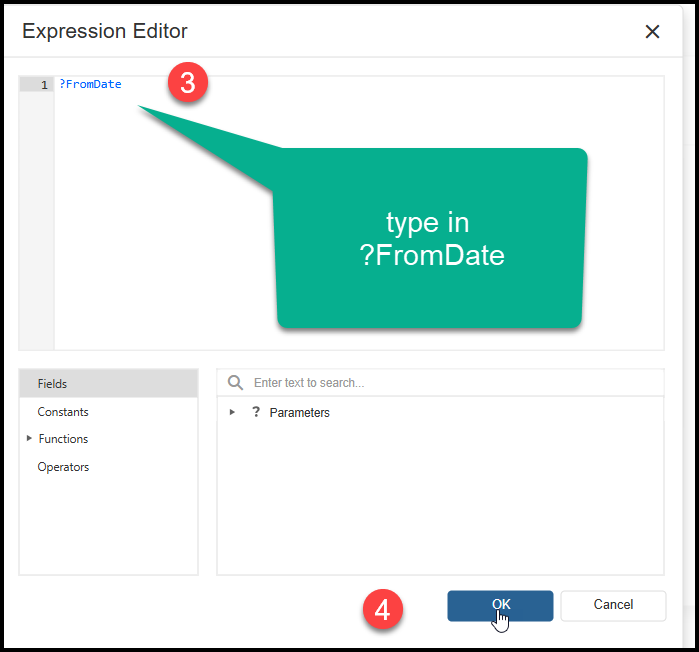
- In the top section at 1, enter the parameter name exactly how it is shown (in the list of available parameters for that Stored Procedure) with no spaces and always starts with a leading ? Use the exact format for the data field including caps where shown.
E.G for File Title the expression may be listed as ?FileTitle or ?FileName (depending on how it is named in the Stored Procedure) or for Document Number the expression is ?DocNumber or for Date ?FromDate or ?DocumentCreationDateFrom.
The important part is to ensure that the Parameter name is added with a preceeding? and the name and format matches exactly to the name shown in the Data Source Wizard.

- Click OK
- Repeat Step 1 - 3 for any of the other Parameters you want to pass to the Report (and were included in the Report design when selecting the Data Fields)
- Click Finish

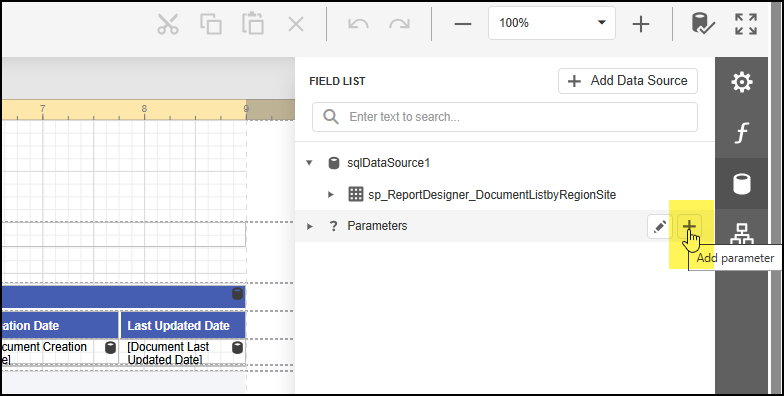
Step 2 Add the Parameter to the Report.
In the Field List, click on ?Parameters and a + sign shows. Click the + to Add a Parameter.
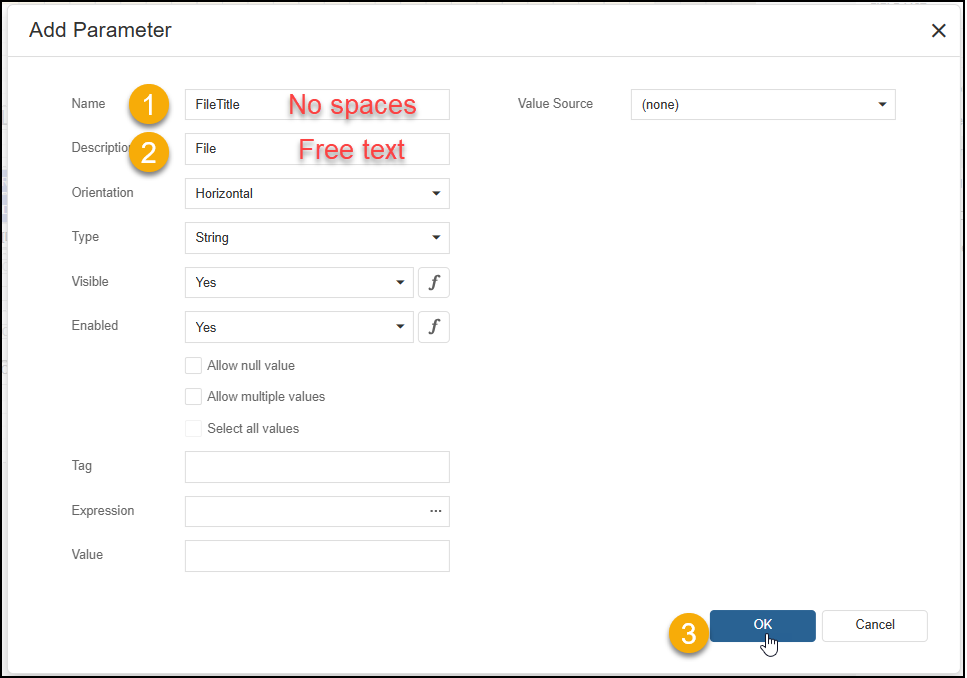
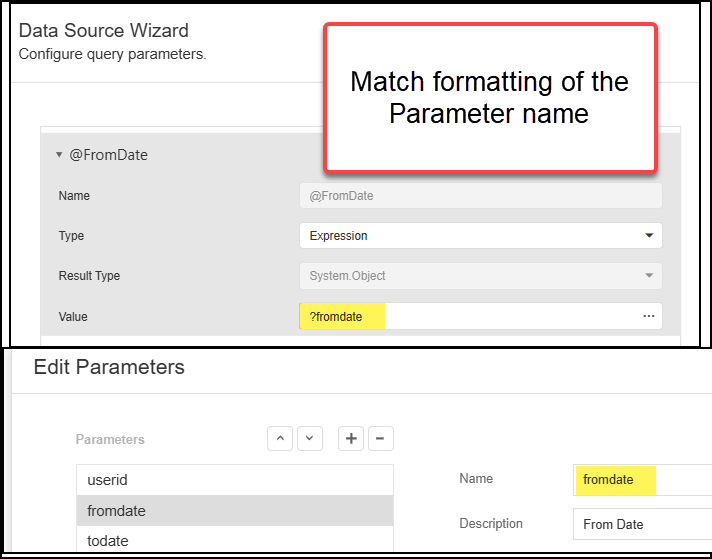
1: In the Add Parameter panel enter the parameter name*, this time without the ? prefix.
2: Add a description which is free text and is what will show as the name of that filter so it doesn't have to be the same name as the parameter. E.G for the parameter DocNumber the description could be 'Document Number or Information Report Number' or "IR#" etc.
The visible and Enabled fields should be Yes. No need to redo the type, expression or value as those have already been set in the previous step.
*Note: The formatting of the Parameter name must match exactly the formatting used of the parameter when it was added in the Expression Editor. E.g if capitals were used for the first letters then that must be repeated when adding a Parameter. Example - if the case format for the value for FileTitle (with capital first letters) is used in the Data Source Wizard/Expression Editor- then use the same case format (minus the preceeding ?) for FileTitle when adding it as a Parameter and NOT lowercase filetitle.
In the Report viewer, if results are not filtering as expected then check that the Parameter case format matches that value in the Data Source Wizard/Expression Editor (minus the preceeding ?).
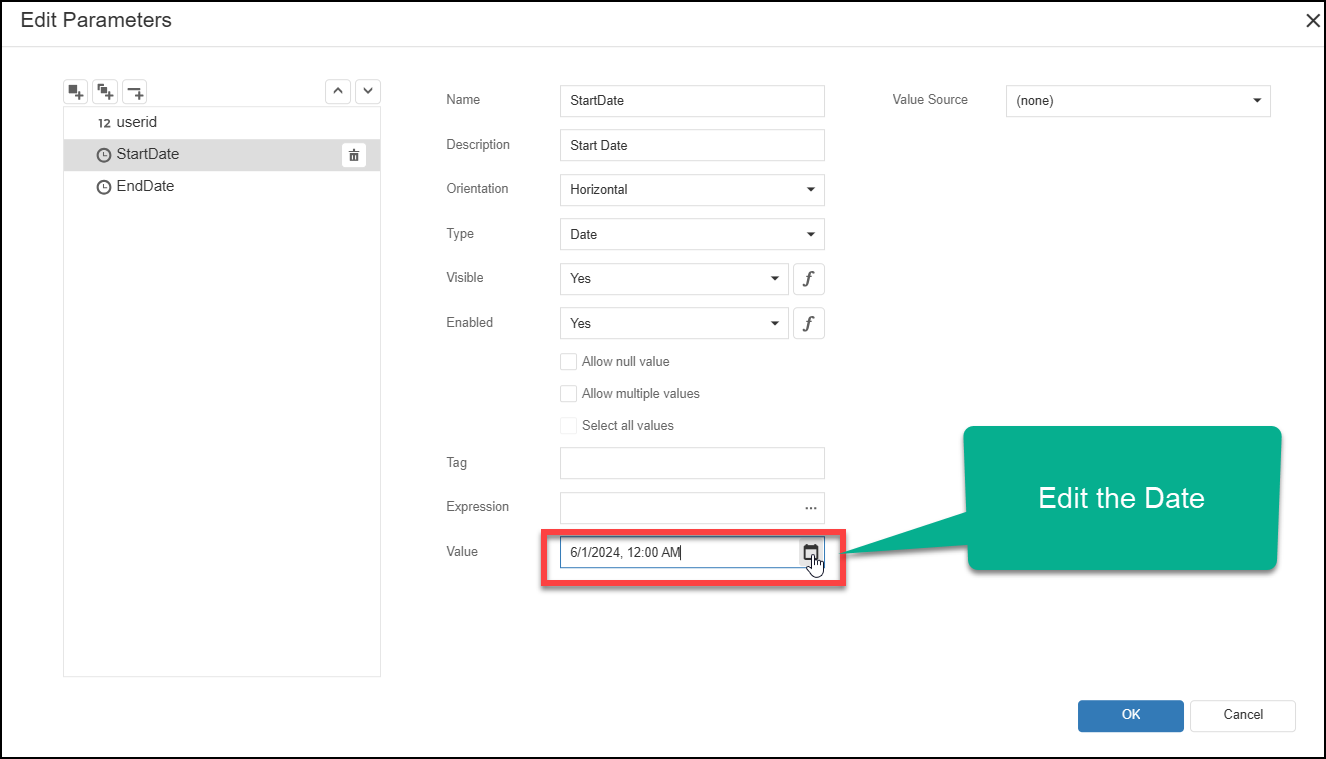
Date Parameter
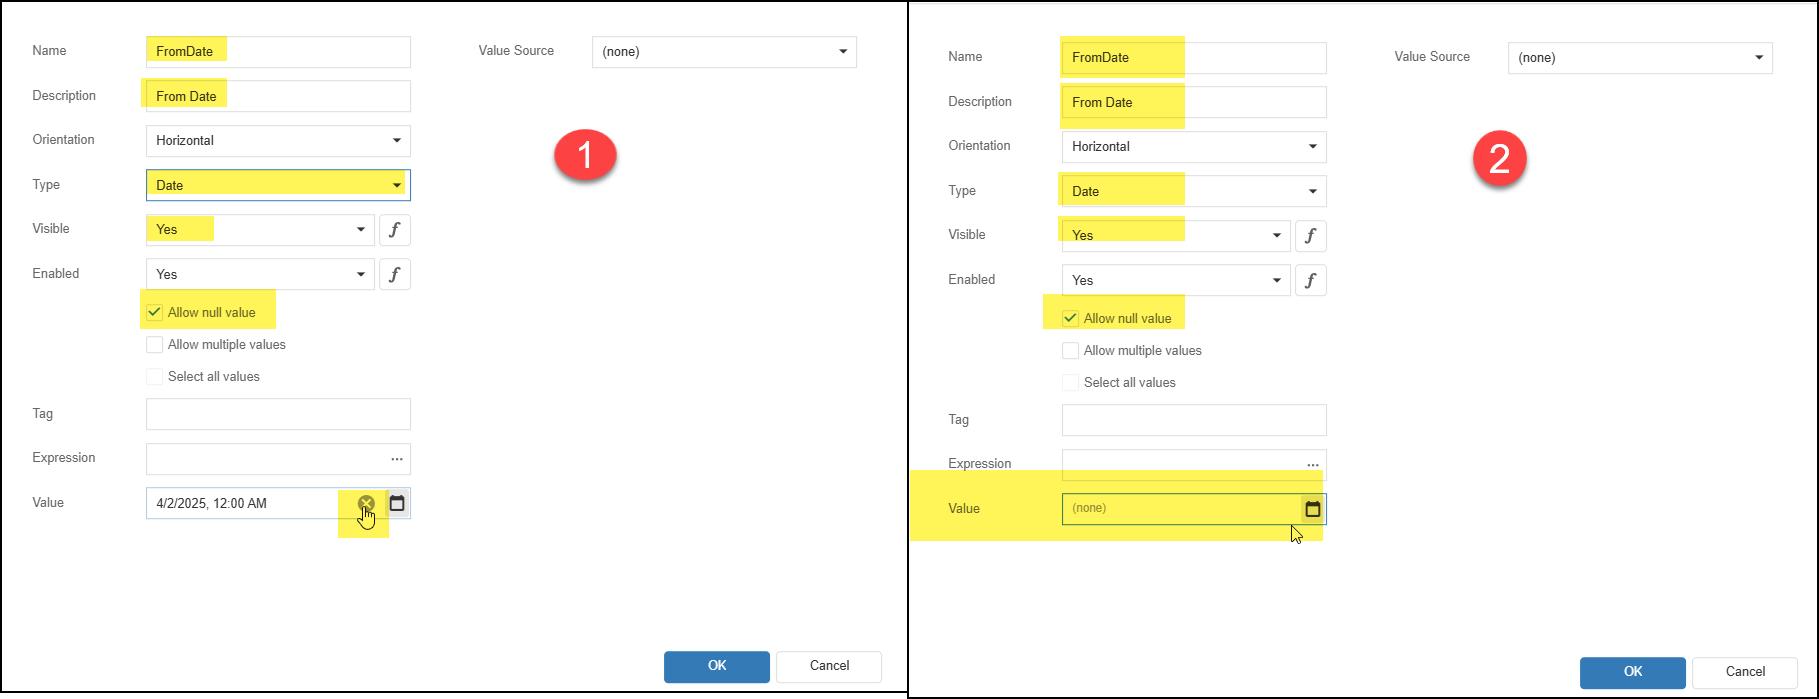
If the value is a Date specify the following
- Name - FromDate (or whatever is the exact match to the name given in the Data Source Wizard) (no space between)
- Description - From Date (free text)
- Orientation - Horizontal
- Type - Date which opens a date selector where you can set the default From Date.
- Visible and Enabled - Yes
- Allow Null value - check this
- Tag - leave blank
- Expression - blank (as this has been pre-set in the Expression editor)
- Option 1 - Value - click x to clear the date (the calendar icon should still be showing)
Option 2 - Value - click into the date field and select the date - Value Source leave as (none)
- Click OK to finish
The Parameter is now added and can be used to filter data in the Report in the Report Viewer.
Note if the 'Allow Null value' is not checked and a date shows in the Value (as per Option 2) then this date becomes the default date setting in the Report viewer. In the Report viewer the date range required can be selected to over-ride the set dates. Or the date can be edited at any time in the Designer - see the following article - Updating a Date Parameter.
Save all changes again in the main report menu before exiting the Report Designer.
Updating a Date Parameter
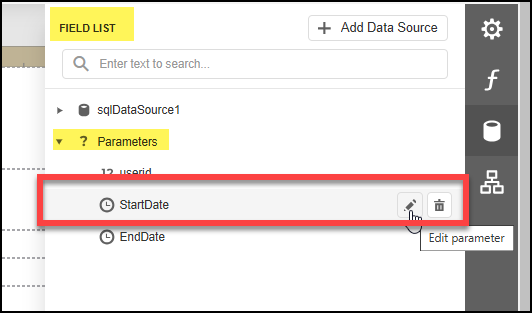
Where a date parameter has not had the date removed from the value - that date is set and will always show the same date in the Report Viewer unless updated in the Designer.
To update the Date specified in a Date Parameter, open the Report Designer and the Field list. Expand Parameters and select the Date Parameter and Edit. Edit the date using the date control and click OK.
Save the Report. In the Report Viewer the date will now show the updated date value.
Add a Lookup Data Source
Lookup data sources are added to the main procedure in the Designer and used to provide specific data to be available as drop-down lists for some Parameters. Examples currently available are Tags, Note Types, Properties.
To add a Lookup data Source, with the Fields open, click on Add Data Source at the top.

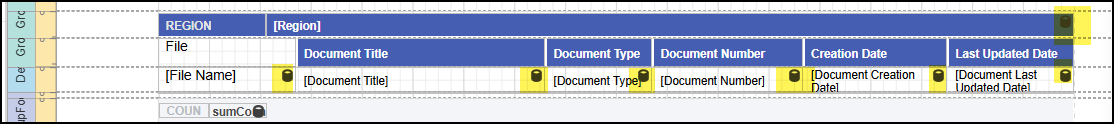
As an example, these are the Lookups added for the Entity Profile Report.
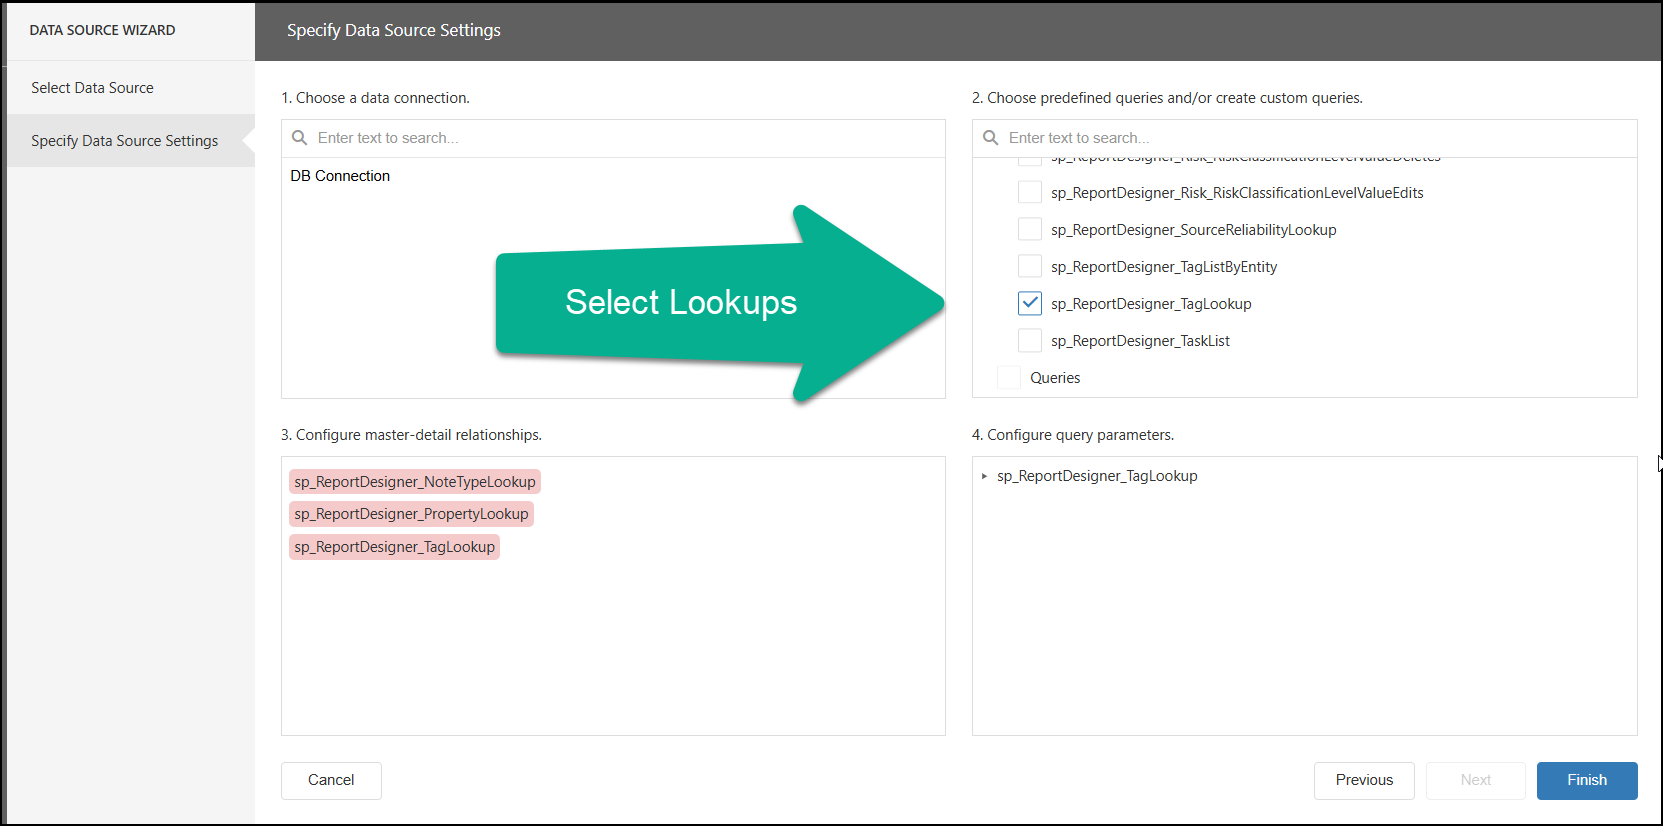
- Select Data Source - the Database is pre-selected so just click Next.
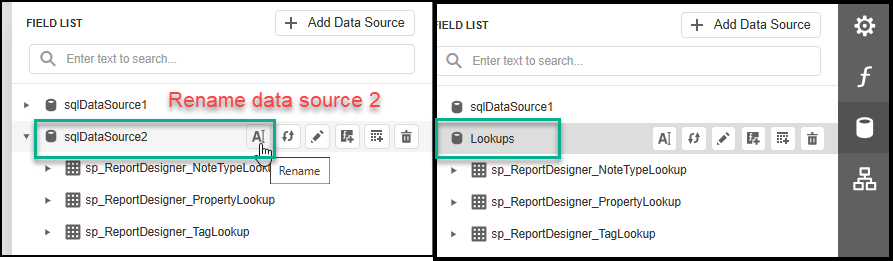
- Select the required Queries (for this Report 3 queries - NoteTypeLookup, PropertyLookup, TagLookup) and click Finish

- Back in the Designer the added queries are grouped under DataSource2. Click on this and select the A icon and rename as Lookups.
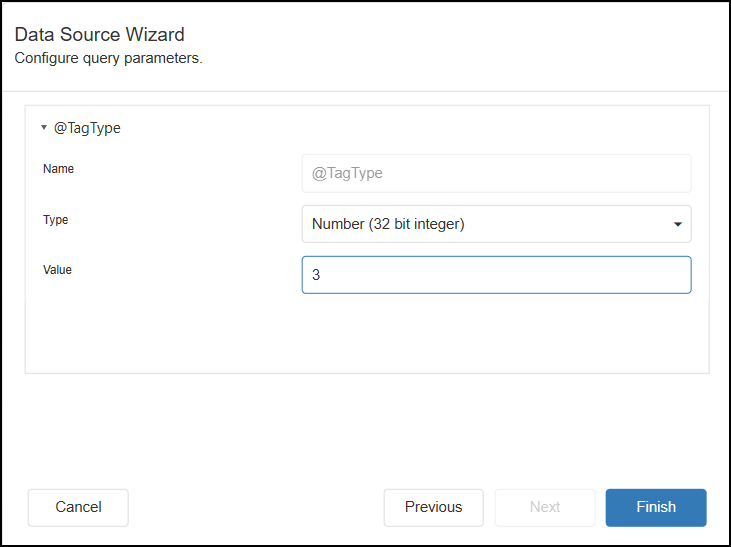
- Click on the Tag Lookup and select Edit. In the Data Source Wizard in the Tag Type value enter 3. Click Finish.

- Next add another Data Source - this is for the Note Tags. In the Queries list select - TagLookup click Finish
- Back in the Designer, rename the just added DataSource query to NoteTagLookup. Expand to view the underlying query and open (edit) the Data Source Wizard -click next, expand TagType - Type = Number (32 bit interger) - in the Value field enter 2 then Finish.
Additional design options can be made using the standard local formatting features and Properties on the main Report Designer page. E.G adding/editing in the Report Title, adding a logo or images, changing a Date format, sorting data, repeating headers, page settings or repositioning of objects or resizing table columns etc.
Remember to Save any changes in the Design menu before exiting or Viewing the Report.
Properties
When a component in the Report is selected, this opens either the Report Explorer or the Properties of the selected component on the right. In this section we will cover some of the basic options.
Add or Edit the Report Title
To edit or Add a Report Title - click on the Report Title in the Report Header band to open the Report Title Properties. The Title can be added or edited either directly into the band or in the Text Property.
In the Appearance Property (expand to view) the font details can be formatted.
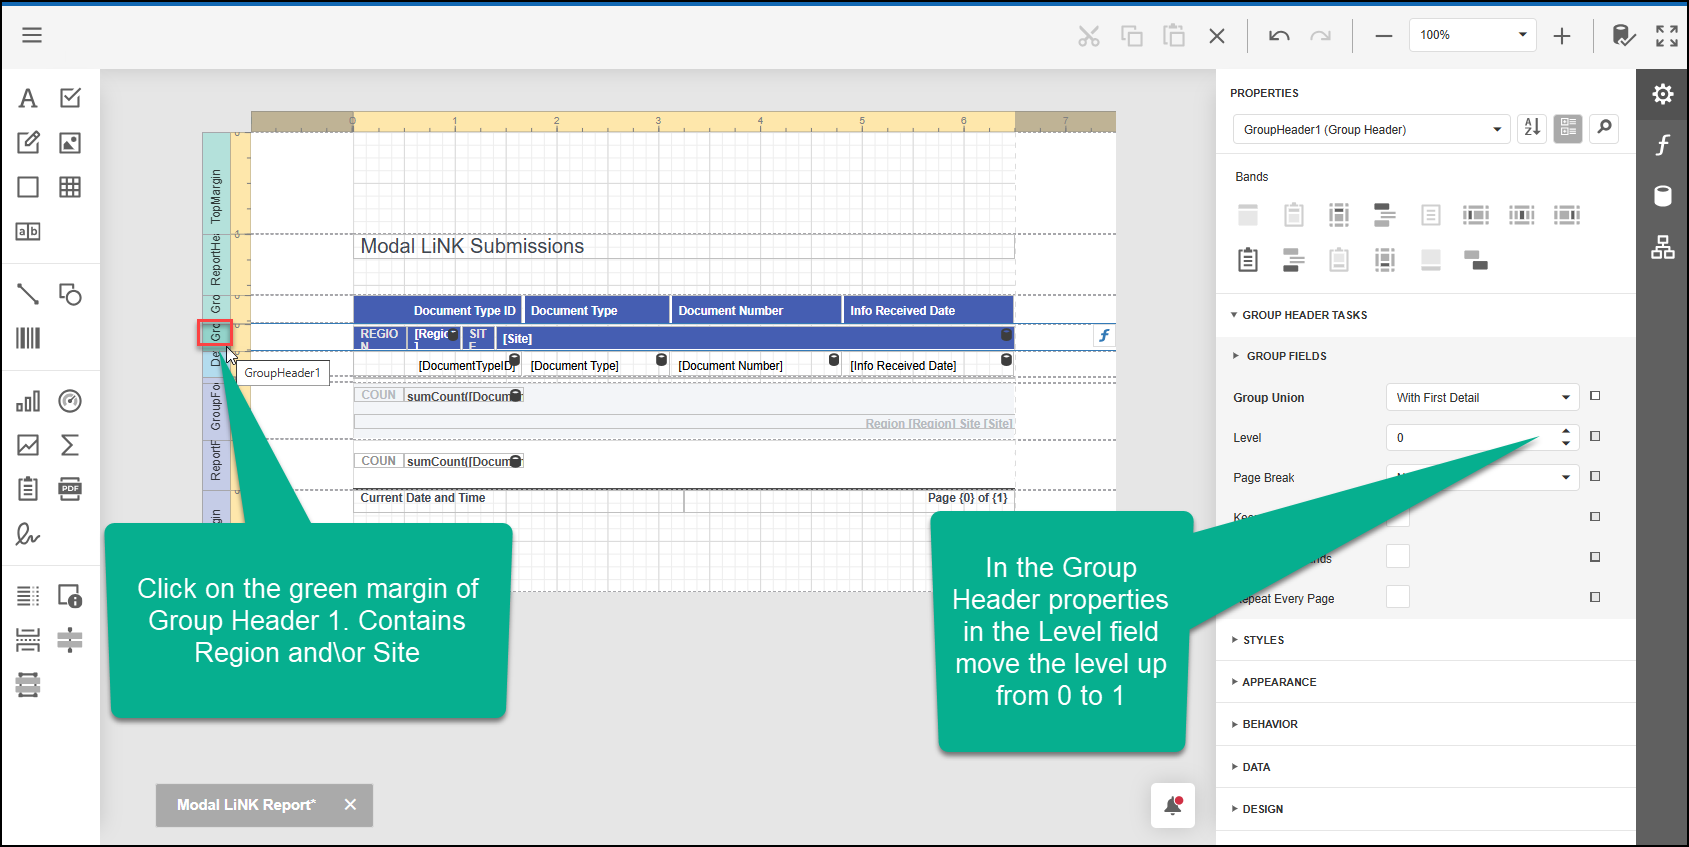
Move a Group band
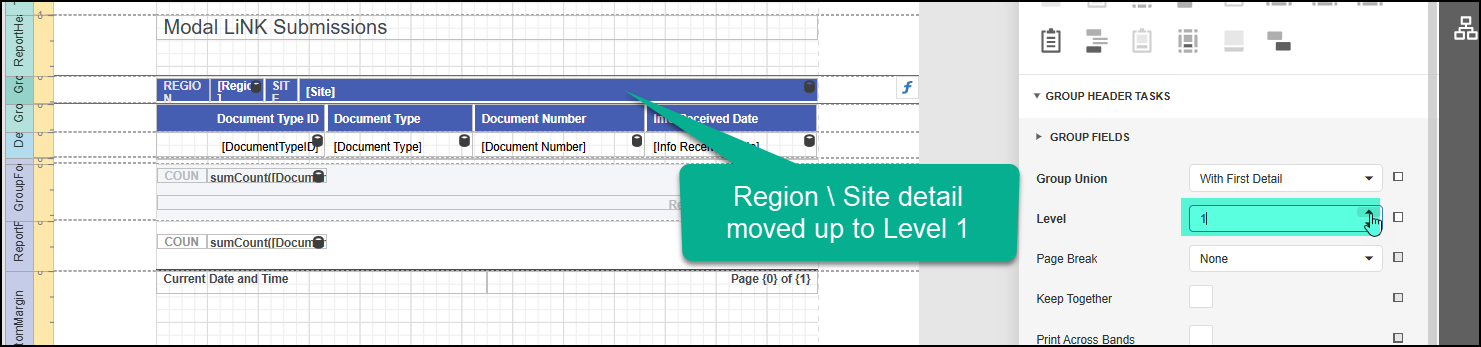
Sometimes a Group band that contains the Group heading details needs to be moved up a level to sit above the Details group header so that is at the top of the data bands e.g if grouping data by Site, Department or File.
To move a Group band up a level, click on the green outer left band - this will open the Properties for the row. Under the Group Fields in the Level property, move the level up to 1.
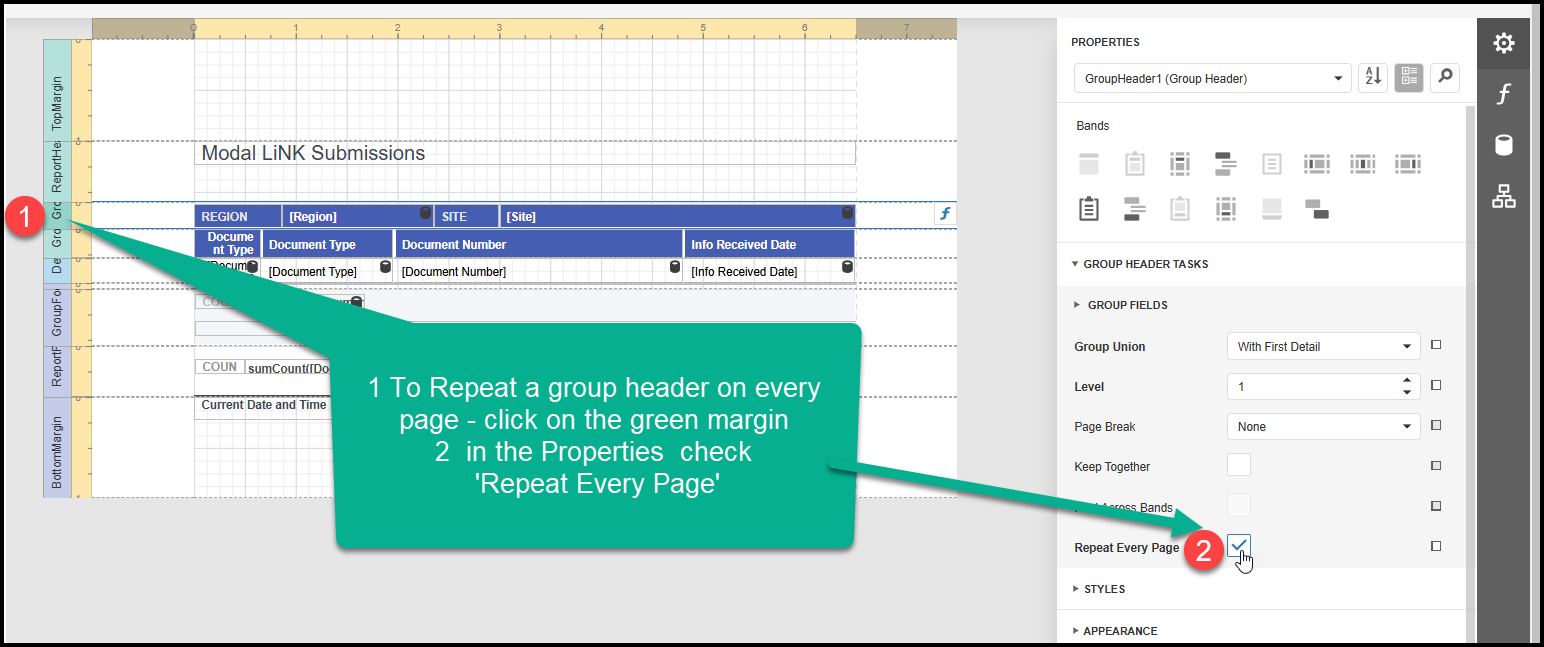
Repeat a band across each page
To repeat a band across each page - e.g the Group Header band, select the band in the left margin to open the band Properties and under Group Fields check - Repeat Every Page. Save the Report.
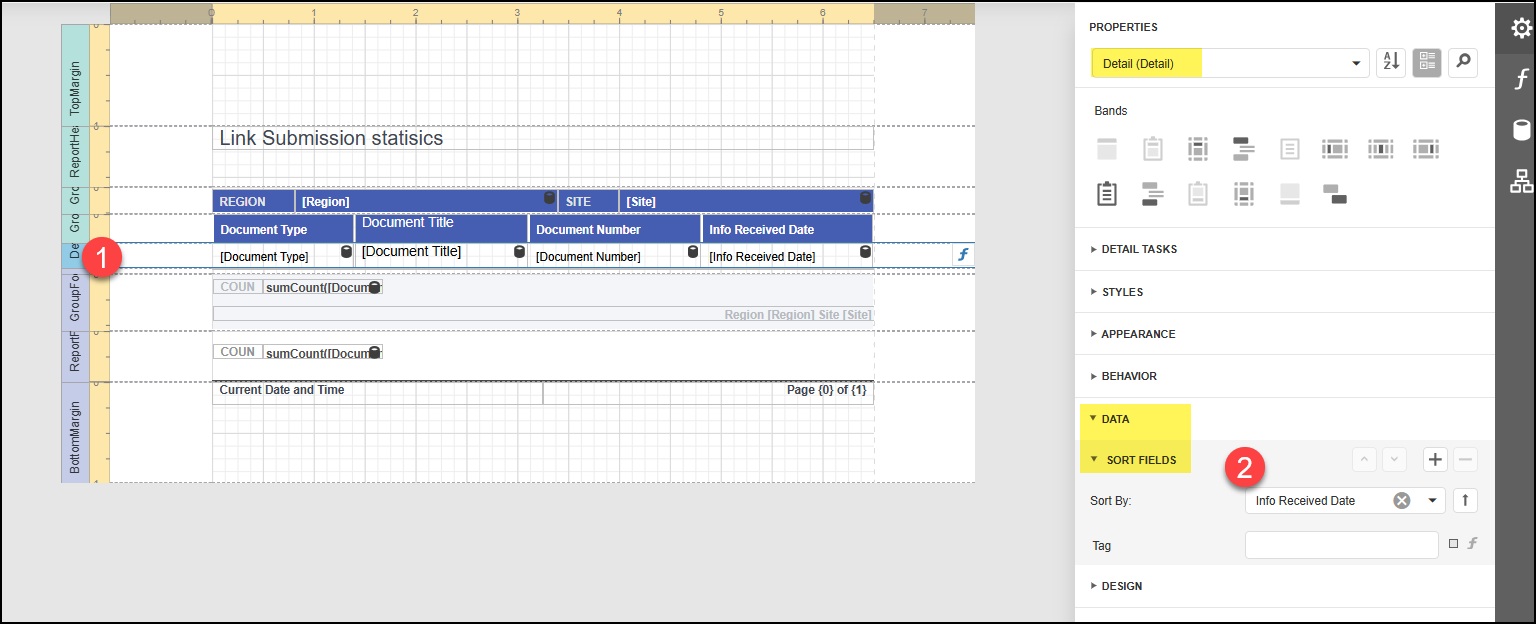
Sort data fields
To sort data fields from the Details band - select the Details band (1) in the left margin then from the Detail Properties expand the Data properties (2). From 'Sort Fields' click + then select the data field name to sort by (this data field must be available in the Report detail). Additional sorts can be added as subsequent sorts.
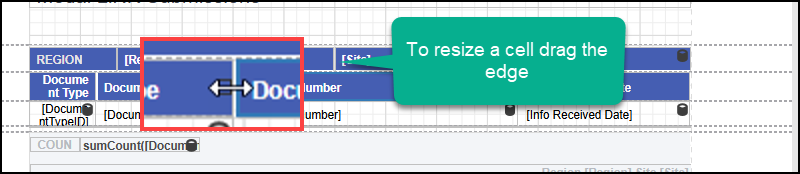
Resize cells
To resize a cell click into a cell to select, then drag the edges - or use the Size property within the Layout properties.
Edit a Group Header title/name
To edit a cell name from a group header band - click on the name (1) to select and the name\title can be edited in the properties.
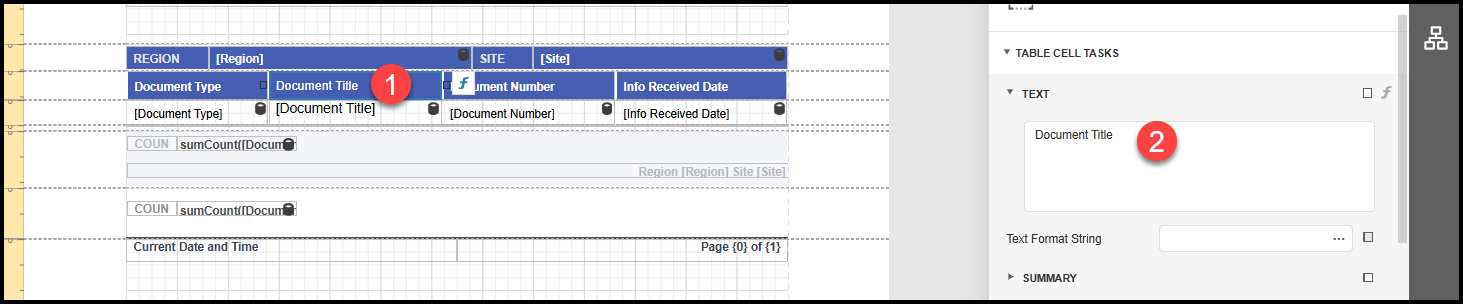
Note: Data field [names] in the Details band (or in headers where grouped) cannot be edited. E.g any cell with a field (cylinder) icon.
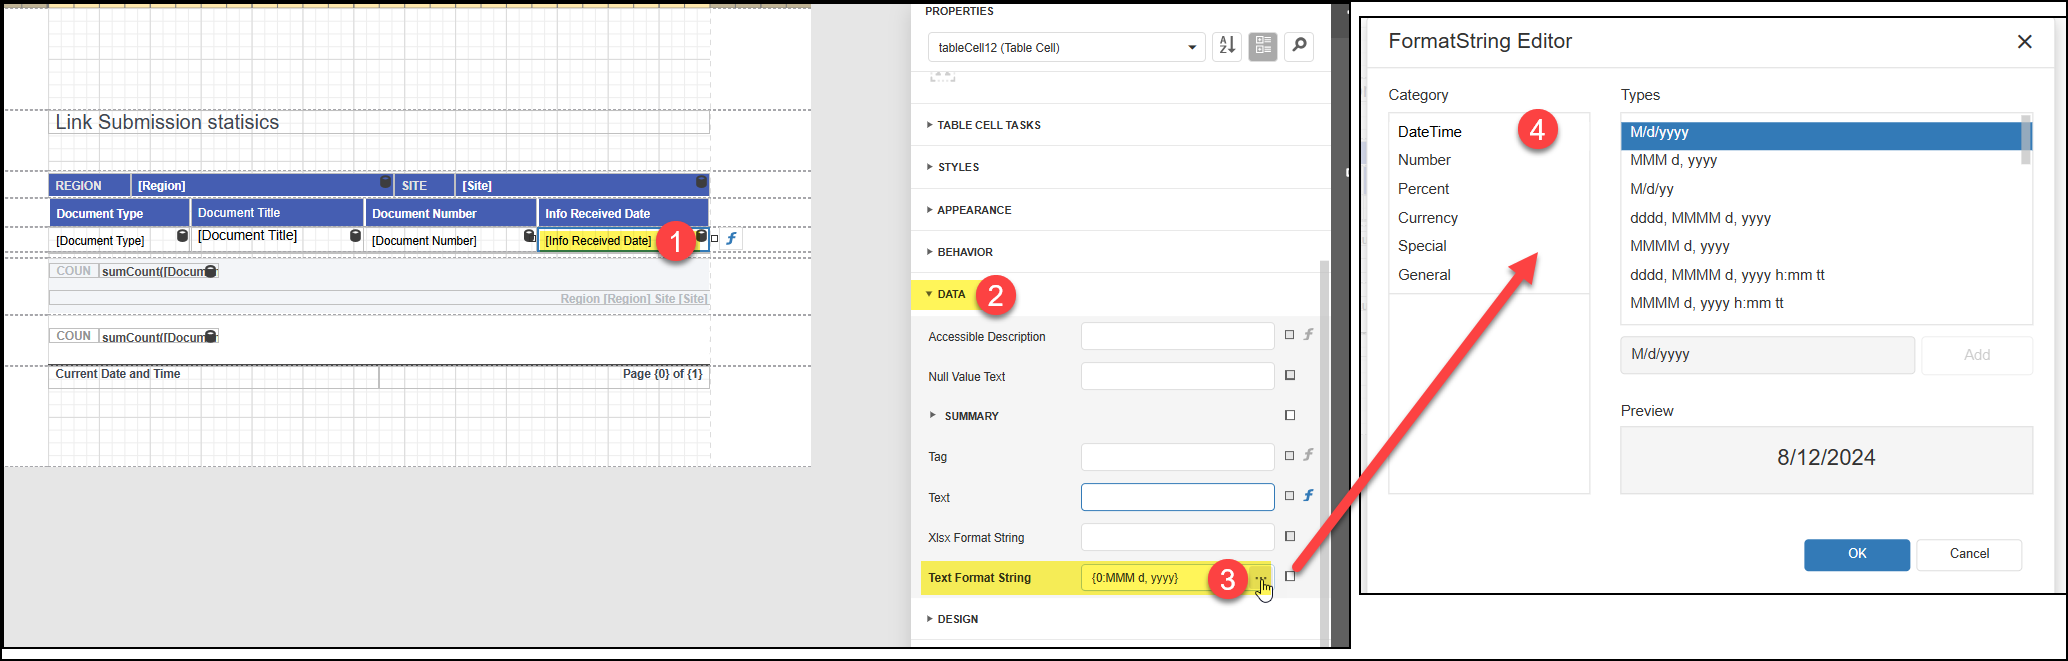
Change a Date Format
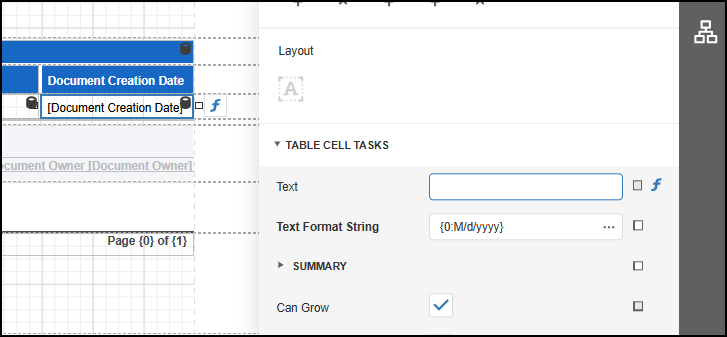
To change a date format - click into the date data field(1) to select and in the properties pane select Data(2) and then 'Text Format String'(3). From the Format String Editor (4) pane select the Format Type required then OK.
Add a new Date Type
The Report date type format defaults to American formatting, to add a different format follow these steps.
To change from the default Date format - follow the same steps as above for 'Change a Date Format', at step 4 enter (over-write) the required format e.g dd/MM/yyyy or d/M/yyyy then click OK.
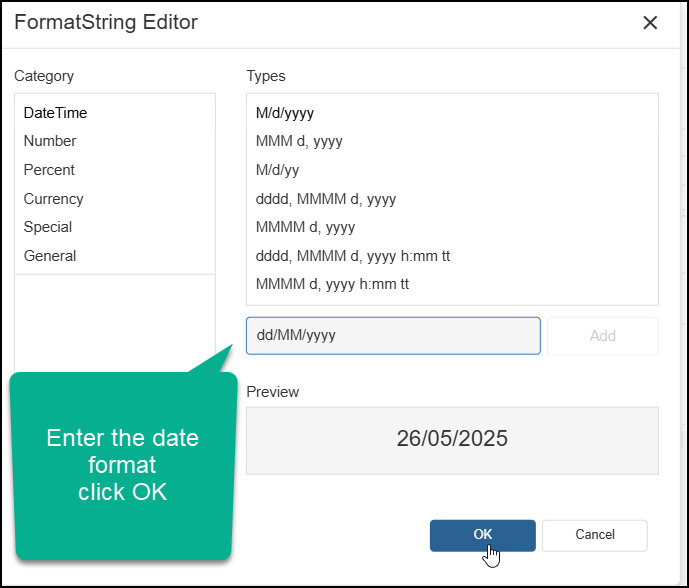
To edit an existing date format - click into the Date field and under the Table Cell Tasks - click into the Text Format String, enter the new format then click Add then OK. The new format is added to the list of available date types.
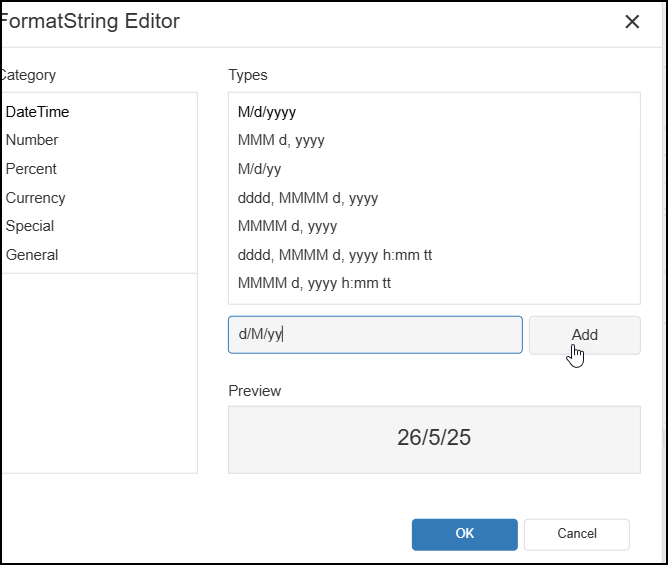
The new formats are added to the bottom of the Type list. To delete an added type from the date Types list - click the X
Add a Data Field
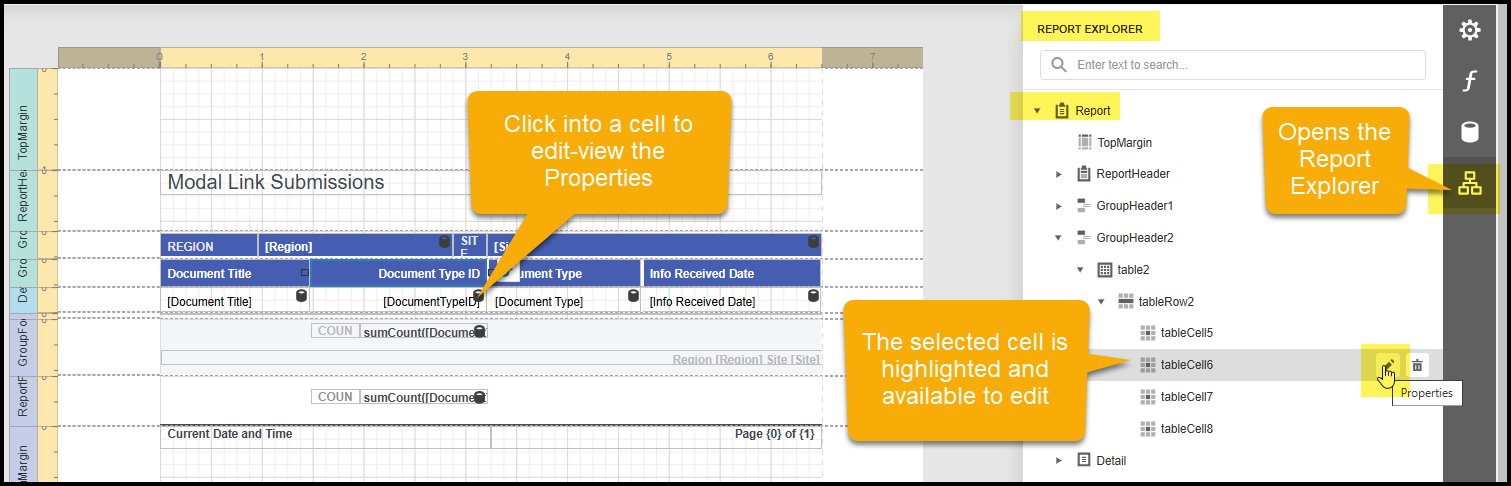
To add a Data Field to the Report (that was not selected during the initial design but is available as a field) open the Report Explorer.
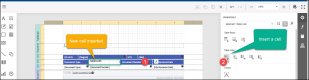
- Insert a cell by clicking into an existing cell in the Group header band.
- This opens the Report Explorer on the right with the Table Cell selected. Select Edit (pen icon)

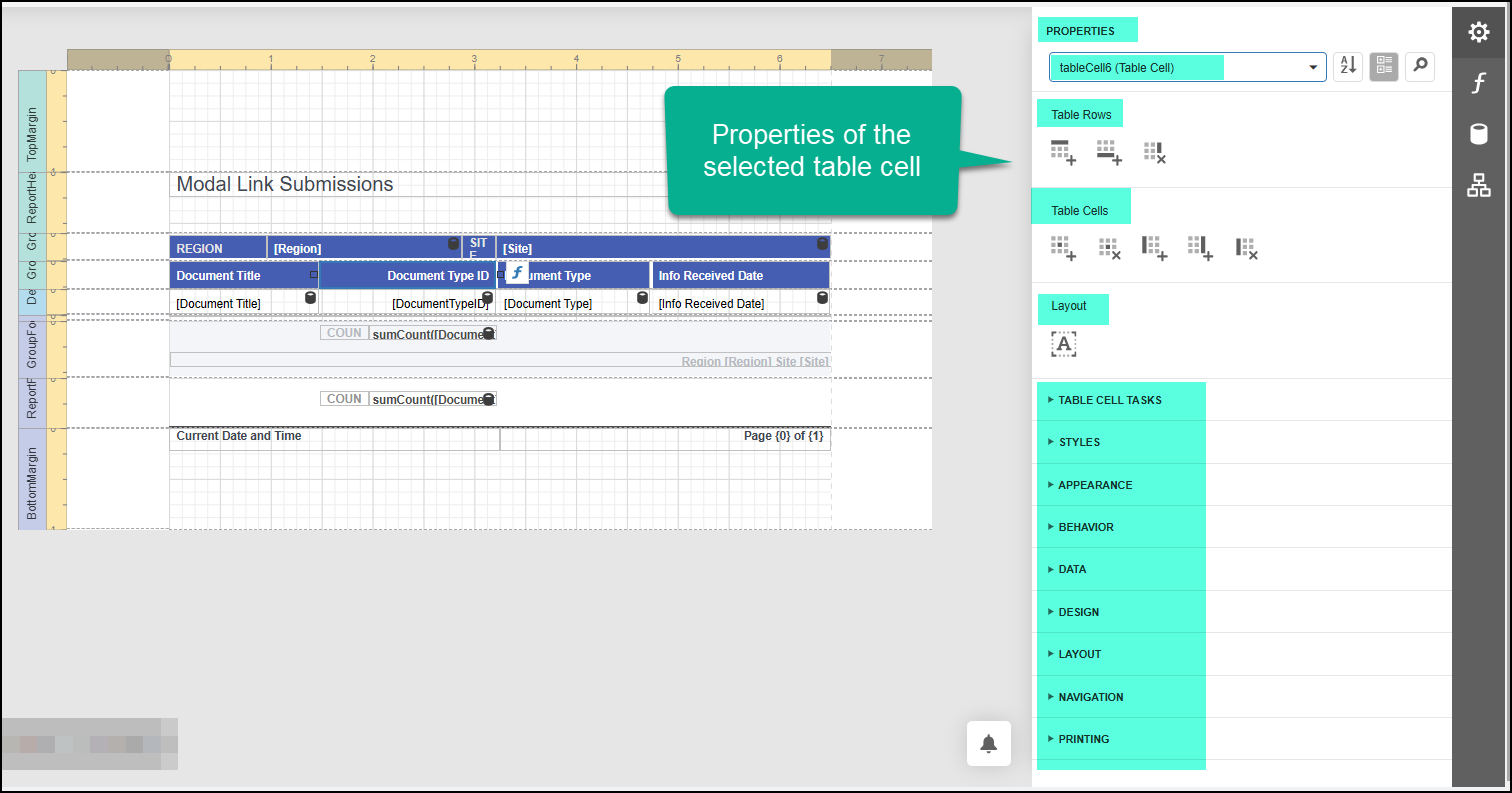
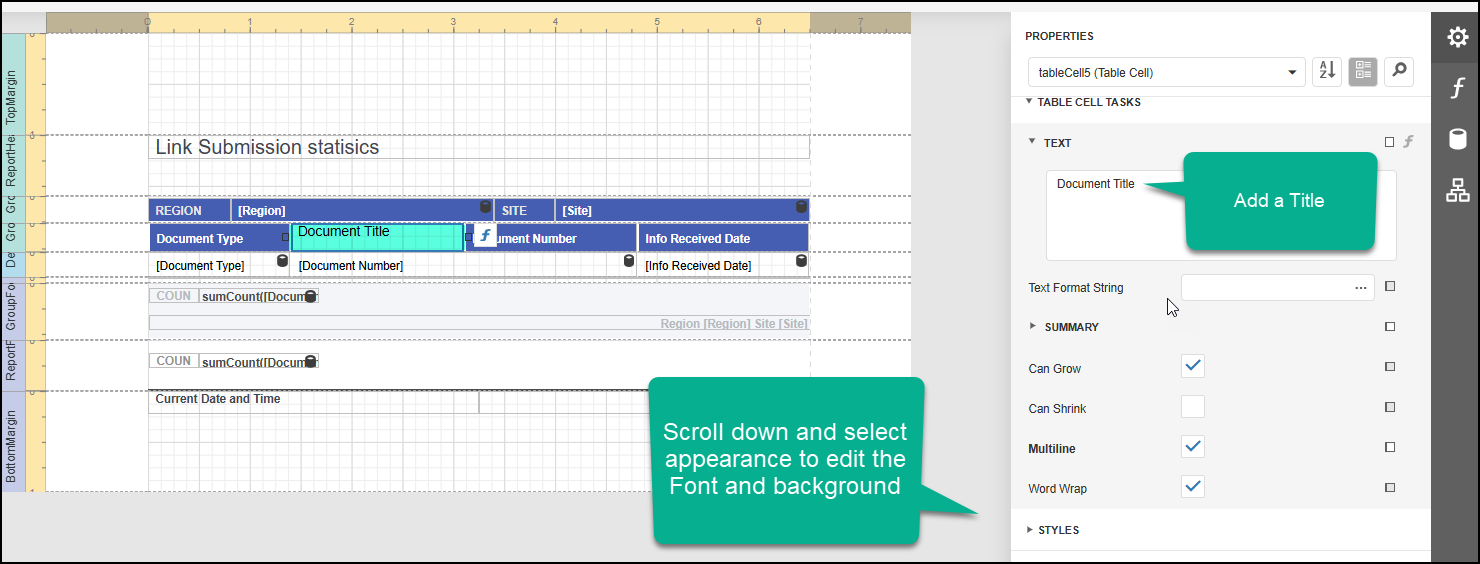
- From the Properties Table Cells click on the + to insert a new cell into the Report.
- From this cell's Properties pane the cell name\title can be entered in the Text detail. The Font and cell background colour can be formatted under Appearance. (Tip - copy these details from an existing cell)

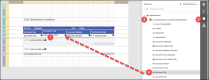
- Repeat 1 - 3 in the Detail band below for the Data field.
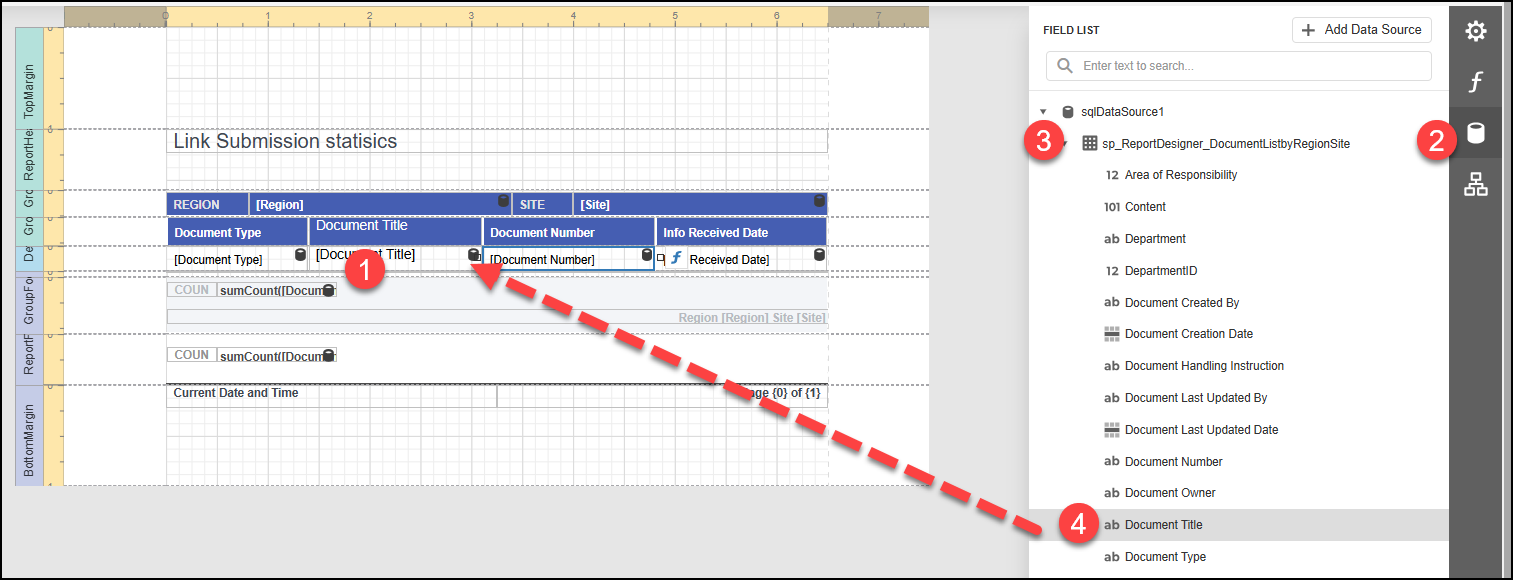
- To add the data field open 'Fields' (2), expand the query (3), then from the data fields drag the required field onto the new cell in the Details band in the Report. (All data fields show with the fields (cylinder icon).


The Design Toolbox that runs down the left side of design page can be used to add Labels, picture holders for Logos and many other features. To add a feature click to select and drag onto the Report. Edits can be made in the Properties of the Feature or by dragging into position or to resize.
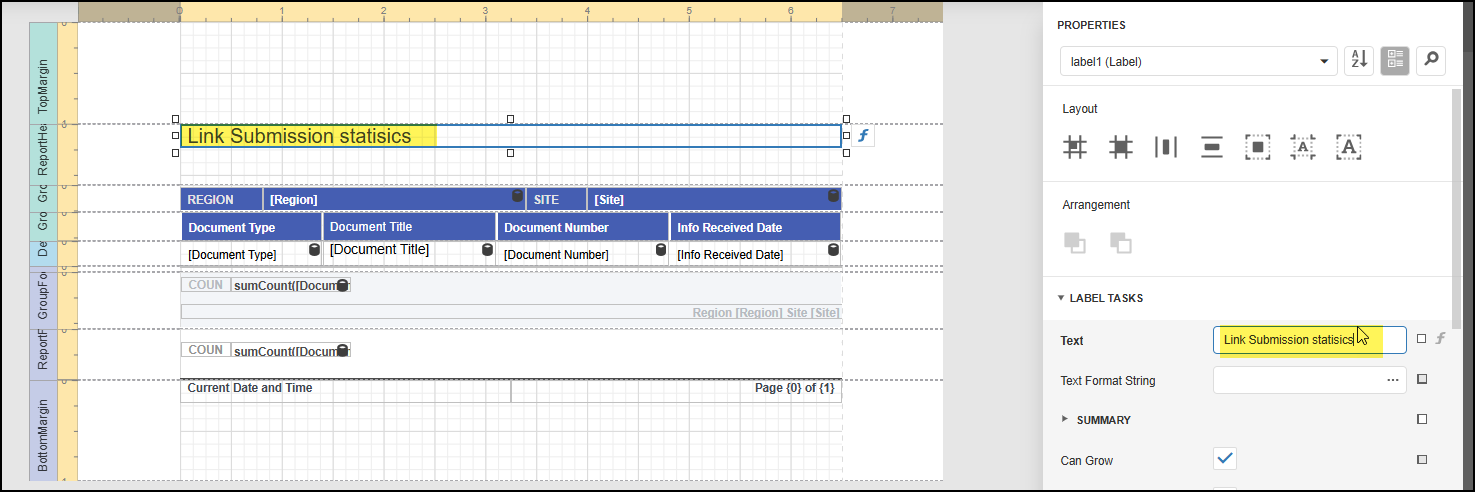
Add a Label
To add a label, e.g add the Organisation Name - From the formatting tools on the left, drag the label A feature onto the Report in the top margin(1). In the label Properties the Text can be added (2) and in the Appearance Property the Font can be formatted(3).

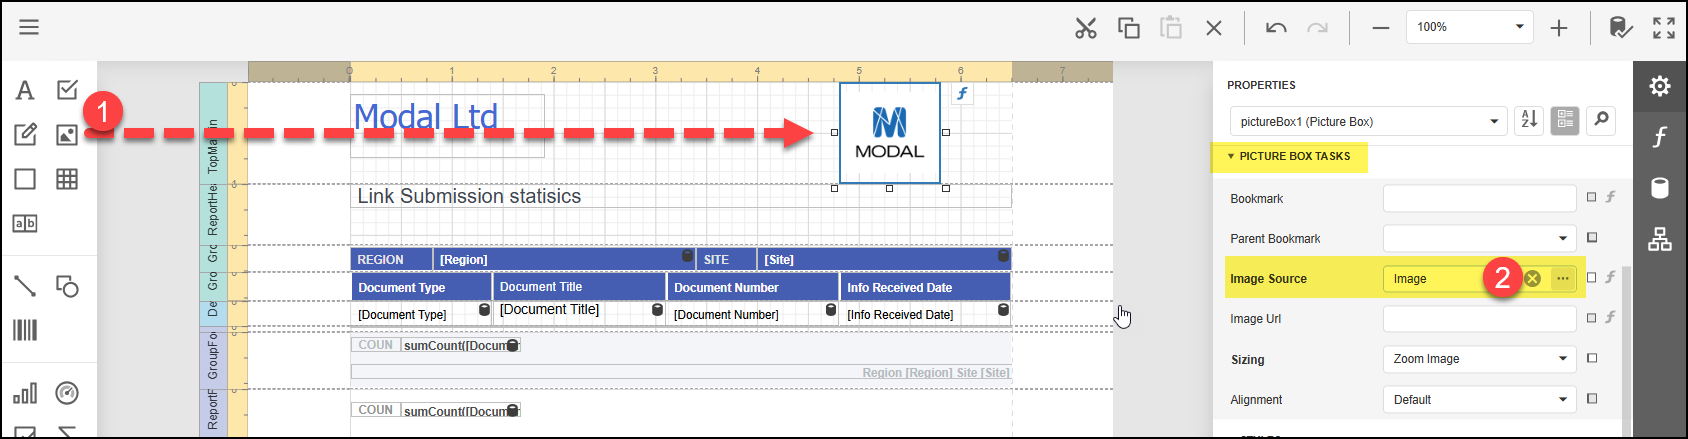
Add a Logo
To add a logo - from the formatting tools on the left, drag the Picture Box (1) onto the Report (Header or top margin). From the Properties in the Image Source Property (2) click on the ellipses (3dots) which opens your Files to select an image \ Logo (tip use a very small image). Once loaded the image can be resized via the properties or by dragging the image edges.
Remember to Save changes in the Design menu before exiting or Viewing the Report.
Once the Report design has been successfully completed and saved, the Report can be viewed in the Report Viewer.
Select Report Viewer from the Report left menu.
Parameters
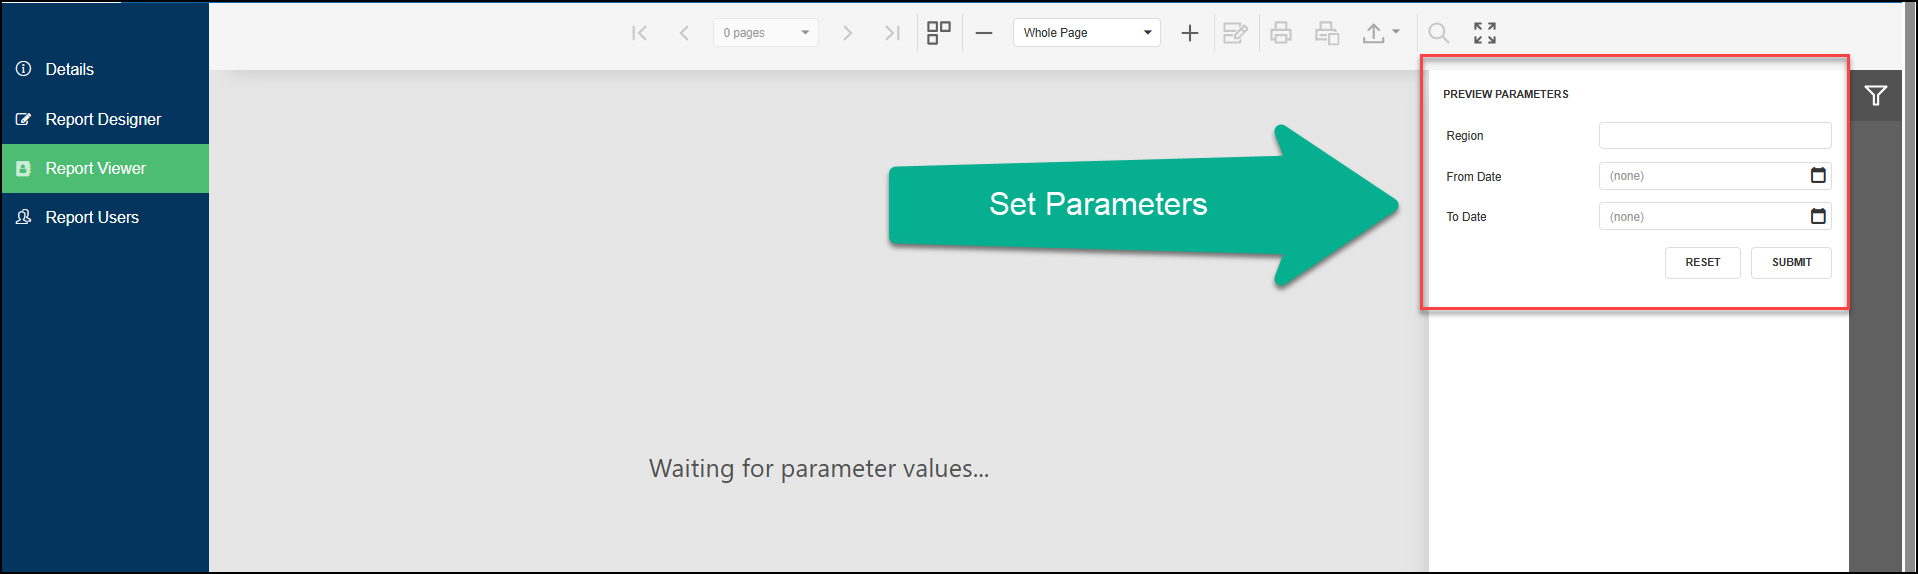
Where parameters have been added, the viewer will show the message - Waiting for parameter values.
These are available as filters on the right. Enter in the specific data for the parameter -e.g Date range, a File, Document, Entity name or number and click Submit. Other than the Date range it is optional to set the other Parameters.
For date parameters - specify the Start (from) and End (to) dates BEFORE clicking submit. Either select the date or enter in as mm/dd/yyyy .
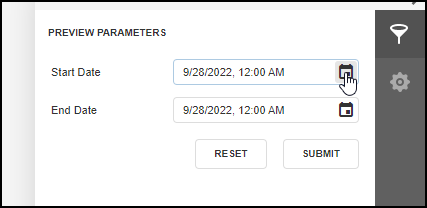
A date with a preset value can be updated within the Report Designer - see Updating a Date Parameter
Select Submit to display the Report.
Or to view the Report unfiltered without any parameters (excluding dates which must be specified), just click Submit.
Selecting Reset will reset any filters applied.
If no Date Range is specified (both the From and To dates) then all data will be returned - if this includes a very large data-set then the system may be overloaded and the Report results would fail to load.
The Report Viewer top tool bar runs across the top of the viewer.

Use this to navigate through or to a specific page, load all pages, zoom and view options, print current page or all, select the File Type to export the Report, open the Search or to view at full screen.
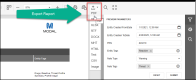
Export Report
To export a Report - from the top menu select the required File Type. The File Type settings are available by clicking on the Settings icon to open the Export Options pane.
For a spreadsheet format the CSV export is easiest for formatting and sorting data.

Search Report Results
The Report search function can be accessed via the Search button in the top tool bar or on the right.
Enter the search word or term and click Search or 'Enter' from your keyboard. Or select Match Case or Match Whole Word. Use the 'find next' arrows on the right or click on a search result to view and locate the result in the Report.
Note; include any spaces or special characters when searching for more than 1 term. E.G if the Entity type label includes (as seen in the Report) brackets or commas before or after the text - (21), 456456 or John, Smith, 01/02/1982


To make the Report available to other users, they must be assigned to the Report via the Report Users page. User permissions apply.
The user that created the Report and any other users assigned to it can access the Report to edit, view and assign users. As user permissions apply, users will only see results for the Departments and Files that they are a member of when they run / view the Report.
Assign User
- To assign a User, select a Department that the User belongs to (if the User is not in the current Department showing).
- The Status should show All.
- In the list of Users check the Users to be assigned.
- Click the Save button.
- Repeat this for each Department that is to have access to the Report. If a User has been assigned access via any Department then they are also automatically assigned where they are members of any other Departments.
To remove a User access - uncheck the User and then Save.
To delete a Report - all users must first be removed from the Report User list.
From the Report Menu open the Report User page, un-check all Users then Save. Repeat this for each Department if the Report is shared across more than 1 Department.
Return to the main Reports list page, then click the Delete (bin) icon alongside the Report.
This user guide can be used to create a LiNK Submissions Report. The report includes From and To date filters and provides a count of submissions received per Region and Site.
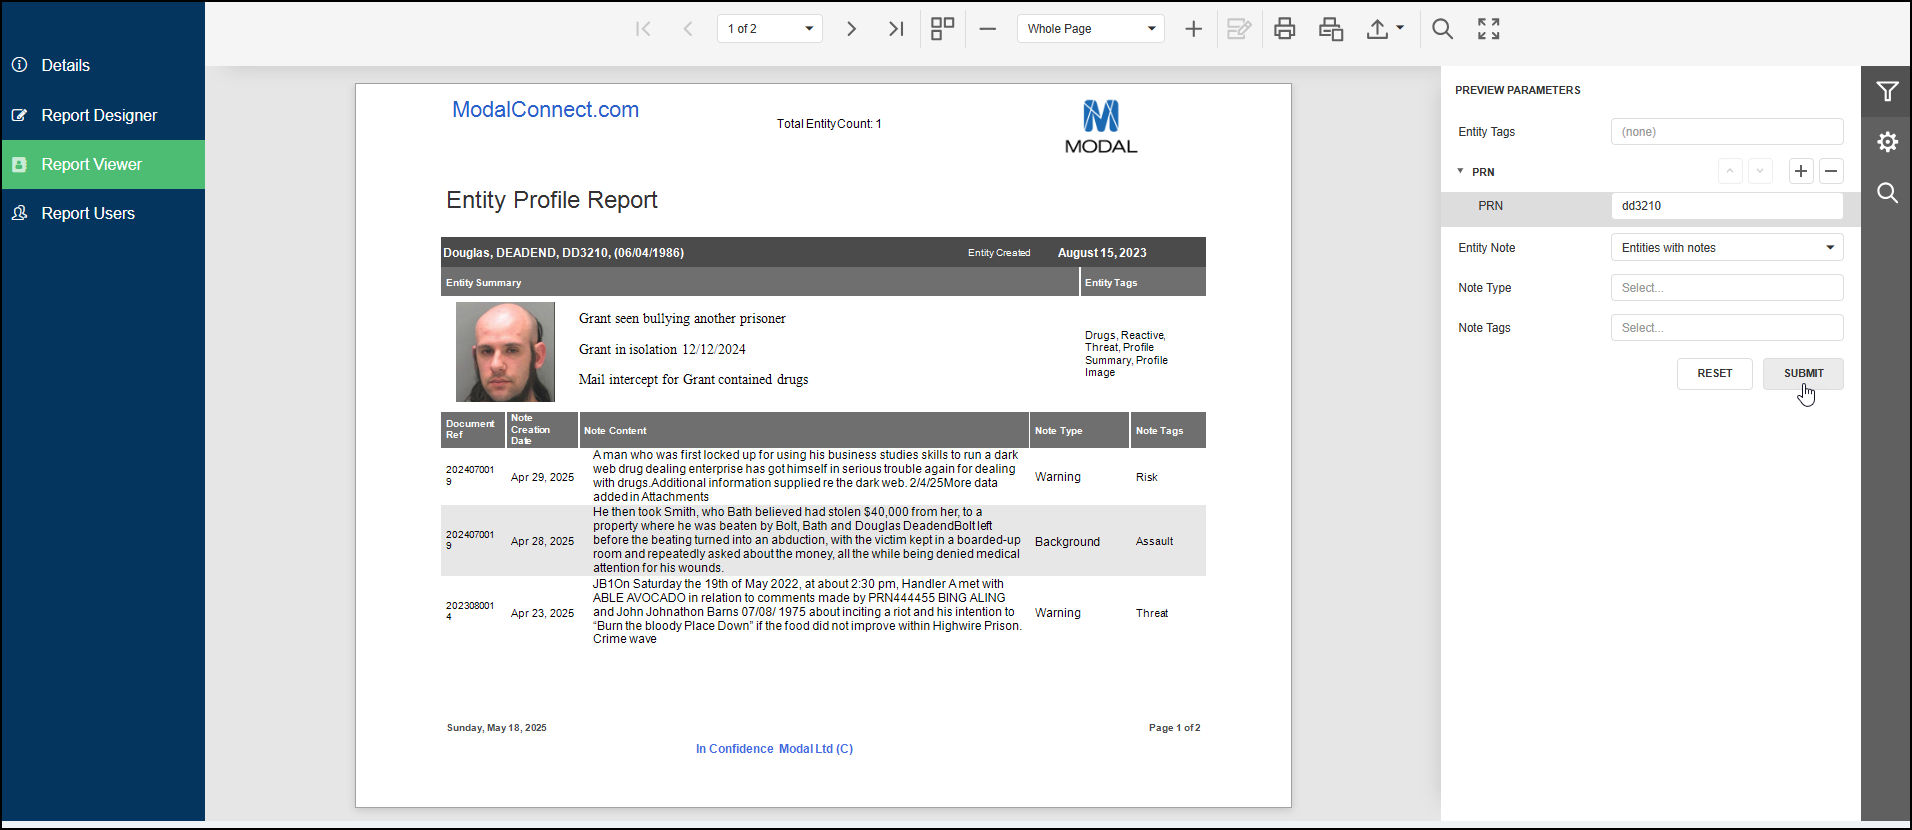
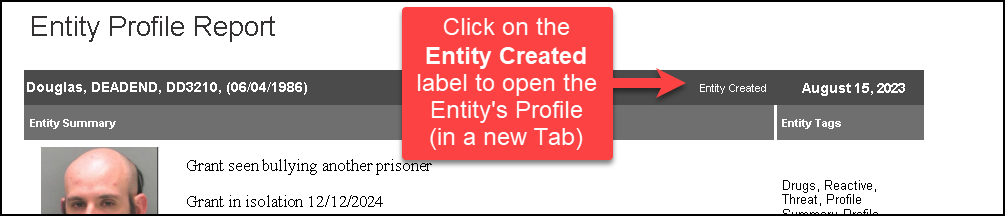
A new Report is now available to report on key details from the Entity Profile.
The Entity Profile Report includes the following details;
- Entity Title
- Entity Created Date
- Entity Profile picture
- Entity Summary content
- Entity Profile Tags
- Entity Notes - includes Note created date, Note Type and Note Tags.
The Entity Profile Report is primarily based on Note Type so results will only include Entities that have at least 1 Note
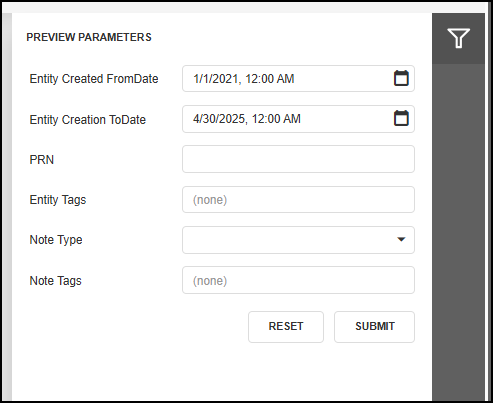
The Report can be run using the following filters (parameters);
- Entity Property - to report for a single Entity (Note - the report is configured to report by a specified Entity Property as specified by your Organisation - e.g. Person ID, PRN, vehicle or vessel number etc).
- Entity Creation From-To Date range - required (sourced from the date the Entity Profile was created)
- Entity Profile Tag/s
- Entity Note Type (default is all)
- Entity Note Type Tag/s (must select Note Type first)
Once the Report has been created for your Organisation, it will be available in the Reports list to users with Report permissions.
Running the Report
To run the Report, select View from the main menu - then Reports. From the Reports list click on the Report Title of 'Entity Profile Report' then from the Report's left menu select 'Report Viewer'.
In the Report Viewer use the filters on the right to specify and set the Parameter values. This enables results to be returned to match the criteria set in the Parameters.
- Entity Created From and To Dates - this is to cover the date range that the Entity Profile/s were created in.
- Property - enter the value of the Property for the Entity to report on - e.g a PRN or other Entity ID (that the Property has been configured for your Organisation).
- Entity Tag/s - select which Entity Profile Tag/s to return results for, or, leave blank to include all Tags. Where more than one Tag is selected, results include Entities that have at least one of the Tags selected E.G Filter results by Tag A, Tag B - any Entity with either Tag A or Tag B or both will be returned. Results will list all Tags of the Entity - not just those used to filter results.
- Entity Note Type - select a (single) Note Type to return results for. Leave blank if no filtering is required and all available Notes assigned to the Entity/s will be returned.
- Entity Note Tag/s - (requires a Note Type to be selected first) select which Note Tag/s to filter results by. Leave blank if Note tag filtering is not required for the selected Note Type.
- Click Submit to run the Report and view results.
- Results are sorted by Entity Creation date.
- The Report can be exported to PDF from the Report top menu.

Notes;
- To run the Report for a single Entity - adjust the date range if required, enter the Entity's Property value (e.g PRN) at step 2 above. Click Submit.
- Results can be further filtered by Entity Tag/s and or Note Type and/or Note Tag/s either prior to clicking Submit or to existing results by clicking Submit again.
- To run the Report for multiple Entities based on Entity Profile Tag/s, specify the date range, leave the Property field blank, select the required Entity Tag/s and click Submit. (Results can be further filtered by Note Type and Note Tag/s).
- To run the Report for multiple Entities by a Note Type , specify the date range, leave the Property field blank, select the Note Type (only allows a single Note Type - to Report on all Note Types leave blank) then click Submit. (Results can be further filtered by Note Tag/s either prior to clicking Submit or against the existing results).
- (Notes are sorted by descending order of the Note Creation Date)
- To view an Entity Profile - click on 'Entity Created' which will open that Entity's Profile in a new Tab.
Key Points:
1: The Entity Profile Report is now available to report on key details from an Entity's Profile (that contains at least 1 Note).
2: Support and training will be provided to set up and configure The Entity Profile Report
3: The Entity Profile Report includes the Entity's Title, Entity creation date, Profile image/photo, Summary content, Entity Tags, Entity Notes - including the Note created date, Note Type and any Note Tag/s assigned.
4: The Report can be exported to PDF directly from the Report Viewer.
In the Task List Report, calculated fields can be added to provide the 'Elapsed Time Since Task Creation' and/or 'Elapsed Time Since Task last Updated'. This article includes instructions and the scripts to use for the calculated fields.
Create the Report using the instructions above Add a New Report and select the Stored Procedure - 'TaskList'
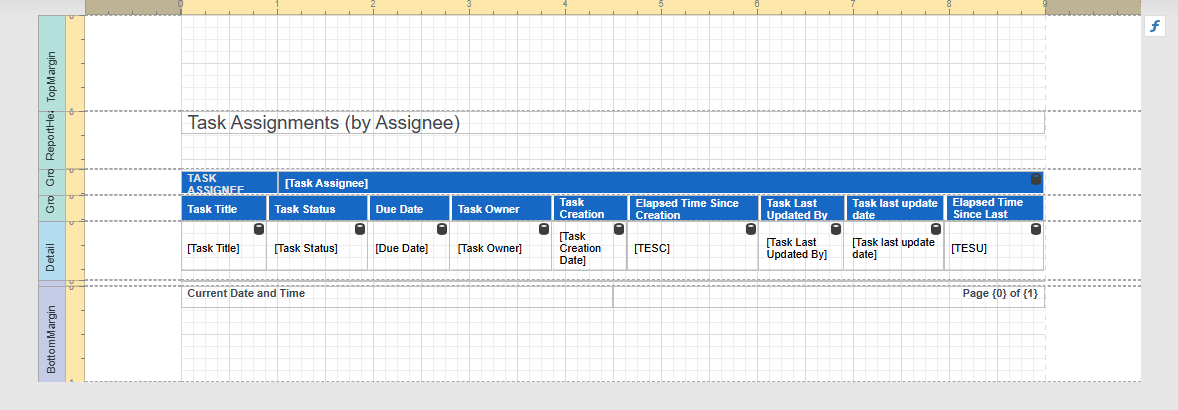
On the Define Report Layout page the following Fields are the minimum recommended for selection in the Report Design; Task Assignee, FileTitle (optional), Task Title, Due date, Task Owner, Task Creation, Task Updated By, Task Last Update Date.
To group the data by Task Assignee, Add a Group using the Task Assignee.
Or to group the data by File Title, Add a Group using the File Title.
The rest of the selected data (including whichever one of Task Assignee or File Title was not used in the Group) will appear in the Report detail band.
On the Specify Page Settings page select Landscape view and Finish.
Back in the Designer move the Group header, for Task Assignee (or FileTitle) to sit above the Detail header band, see - Move a Group band.


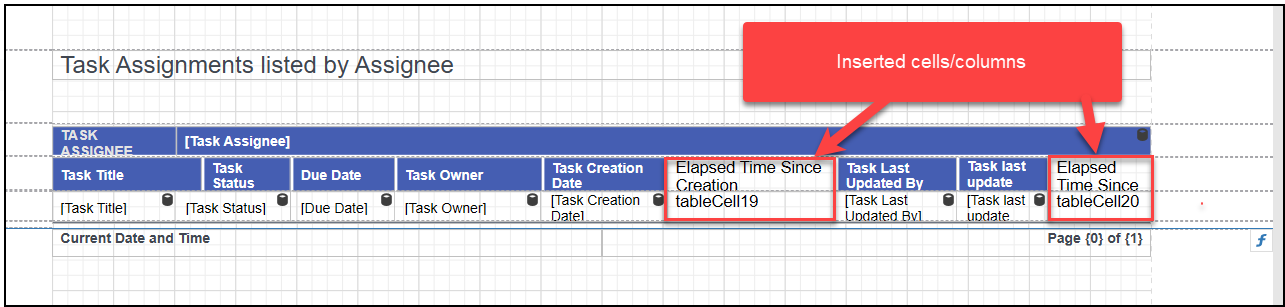
Insert cells or columns for both the calculated field names and where the data goes underneath using the steps covered in 1-5 in Add a Data Field. Add the name of the Field (this is free text) e.g 'TESC' (Time Elapsed Since 'Last' Update) and 'TESU' (Time Elapsed Since 'Last' Update) in the Group Header above the Detail band. Use the Report Explorer to apply formatting for the Appearance or to the Date formats (but not the calculated Date Fields).
Save the Report
The calculated fields can be added using the following steps;
Open Fields
- From the query click on the Function icon
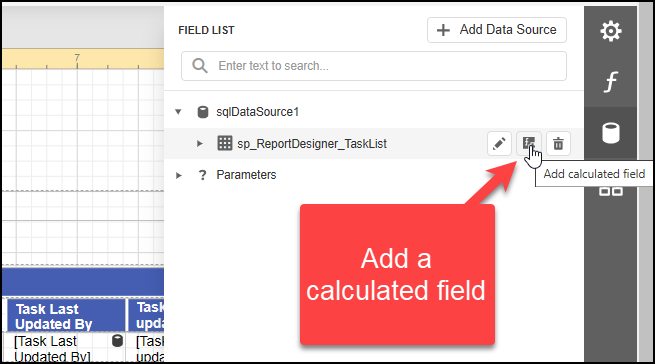
- Select Edit from the added calculatedField
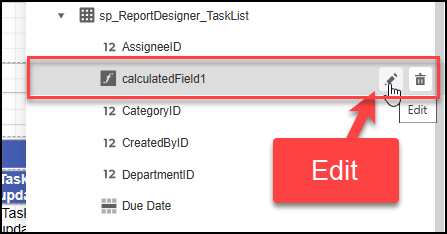
- Complete the details as shown.
Title & Display Name = TESC (Time Elapsed Since Creation 'date'),
Field Type = String,
Data Source = none,
Data Member = the Query title should automatically show.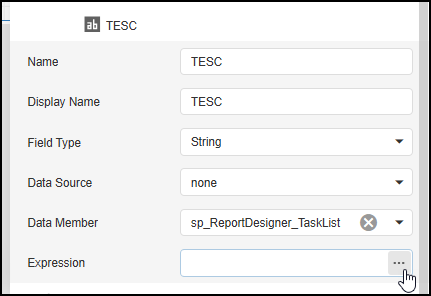
- Expression - in the Expression field copy and paste the following detail
- Repeat steps 1 - 3 use TESU (Time Elapsed Since 'last' Update) for the Name and Display name.
- In the Expression field copy and paste the following detail
- Now the calculated fields can be dragged and dropped onto the Report as per step 6 of Add a Data Field
- Save the Report.
The Report can now be viewed/run in the Report Viewer.
Note When the elapsed time is past a day, the hours, minutes & seconds are omitted for Task Elapsed Since Created and Task Elapsed since Updated
Viewing Tips
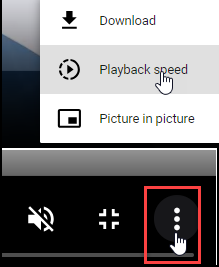
To view a video at full screen, click on the 'Full screen' button.
To adjust the playback speed (decrease or increase) click on the 3 dots and select Playback speed.
Captions display best if the mouse or touch-pad are not moved or engaged once playing.
Videos have no audio.

|
|
||
| Create a Report | The Report Viewer | Managing Report Users |
| Report Layout - Grouping data | Report formatting options | Adding parameters to filter results |
| Create a Master Detail Report |